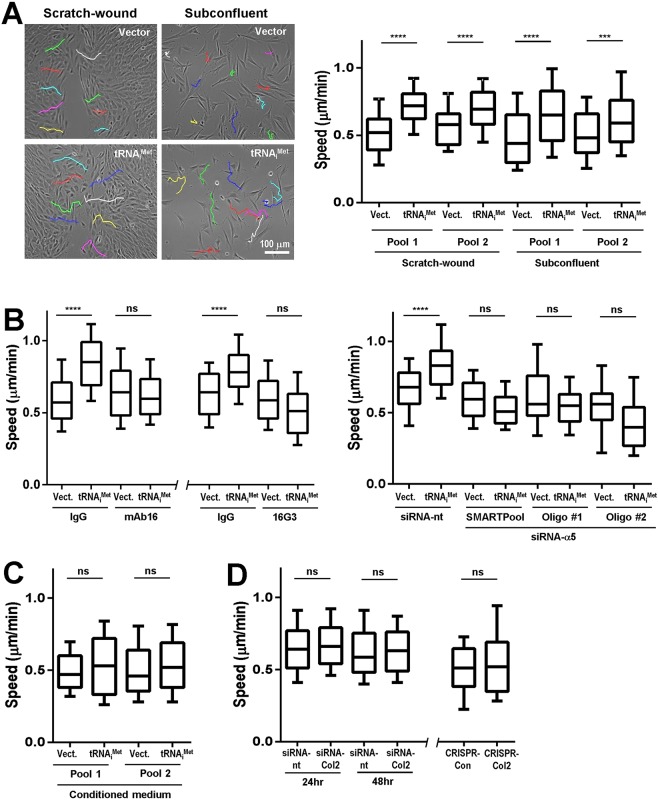
Fig. 1.
Elevated levels of tRNAiMet promote α5β1-dependent cell migration. (A) Immortalised mouse embryonic fibroblasts (iMEFs) were stably transfected with a vector encoding tRNAiMet or an empty vector control (Vect.) (2 independent pools of each). The migration speed of cells plated subconfluently, or of those moving into scratch-wounds was determined using time-lapse microscopy followed by cell tracking. Representative cell trajectories are displayed in the left panels. Data are represented as box and whisker plots (whiskers: 10-90 percentile), n=3 independent experiments; ****P<0.0001; ***P<0.001; Mann–Whitney test. Scale bar: 100 μm. (B) iMEFs expressing tRNAiMet or an empty vector control (Vect.) were transfected with siRNAs targeting α5 integrin (siRNA-α5; either a SMARTPool or two individual siRNA oligonucleotides as indicated), a non-targeting control (siRNA-nt) (right panel) or were left untransfected (left and centre panels). Cell were plated onto plastic surfaces in the presence of blocking antibodies against α5 integrin (mAb16; left panel), the RGD-containing integrin-binding site in fibronectin (16G3; centre panel) or the appropriate isotype-matched control antibody (IgG). Cell migration speed was then determined as for A. Data are represented as box and whisker plots (whiskers: 10-90 percentile), n=3 independent experiments; ****P<0.0001; ns, not significant; Mann–Whitney test. (C) Conditioned medium was collected from iMEFs stably transfected with a vector encoding tRNAiMet or an empty vector control. Conditioned medium was then incubated with iMEFs and the migration speed of the cells determined as for A. Data are represented as box and whisker plots (whiskers: 10-90 percentile), n=3 independent experiments; ns, not significant; Mann–Whitney test. (D) iMEFs expressing tRNAiMet were transfected with siRNAs targeting collagen II (siRNA-Col2) or a non-targeting control (siRNA-nt), or iMEFs that had the collagen II gene disrupted using CRISPR (CRISPR-Col2) and their appropriate CRISPR control (CRISPR-Con) [see Clarke et al. (2016)] and their migration speed was determined as for A. Data are represented as box and whisker plots (whiskers: 10-90 percentile), n=3 independent experiments; ns, not significant; Mann–Whitney test.

