Fig. 3.

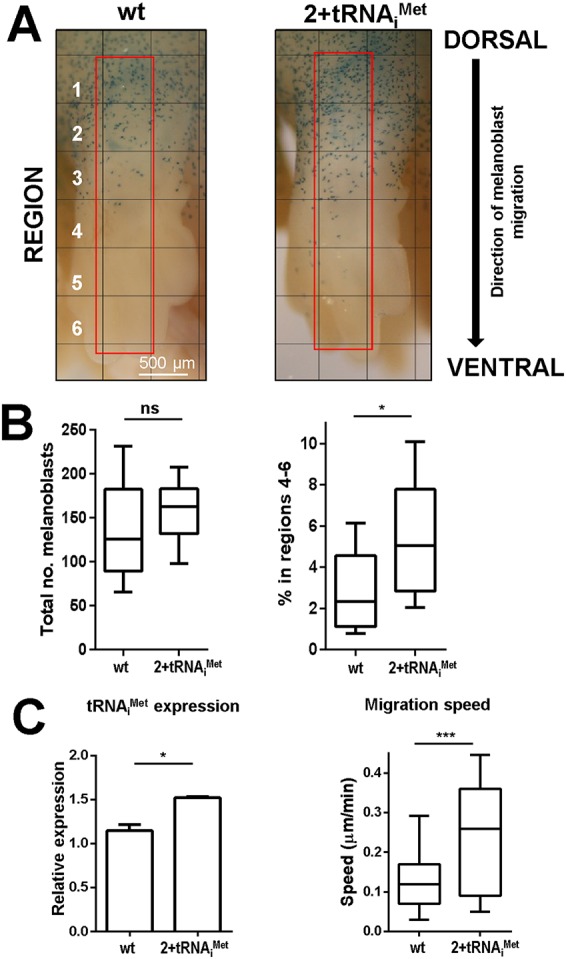
Elevated expression of tRNAiMet drives melanoblast migration in the developing embryo. (A) Wild-type (wt) and 2+tRNAiMet mice were crossed with a line expressing β-galactosidase under a melanoblast-specific promoter (DCT-LacZ). Embryos were removed at E13.5 and stained for β-galactosidase expression to visualise melanoblasts (A), and the total number (B; left panel) and proportion of β-galactosidase-positive cells within regions 4–6 (B; right panel) of the forelimbs was scored (B, left and right panels). Data are represented as box and whisker plots (whiskers: 10-90 percentile); *P<0.05; ns, not significant; Mann–Whitney test. (C) Wild-type and 2+tRNAiMet mice were crossed with animals that were null for p16INK4A and that expressed a mutant allele of NRas under the melanoblast-specific tyrosinase promoter (Tyr-NrasQ61K; INK4a−/−). Melanocyte cell lines derived from the early pup skin of these Tyr::NrasQ61K/°; INK4a−/−; wild-type (wt) and Tyr::NrasQ61K/°; INK4a−/−; 2+tRNAiMet mice were plated onto plastic surfaces and their migration determined using time-lapse microscopy as for Fig. 1A. Data are represented as box and whisker plots (whiskers: 10-90 percentile) (right panel) and as mean±s.e.m. (left panel) as indicated; *P<0.05; ***P<0.001; Mann–Whitney test.
