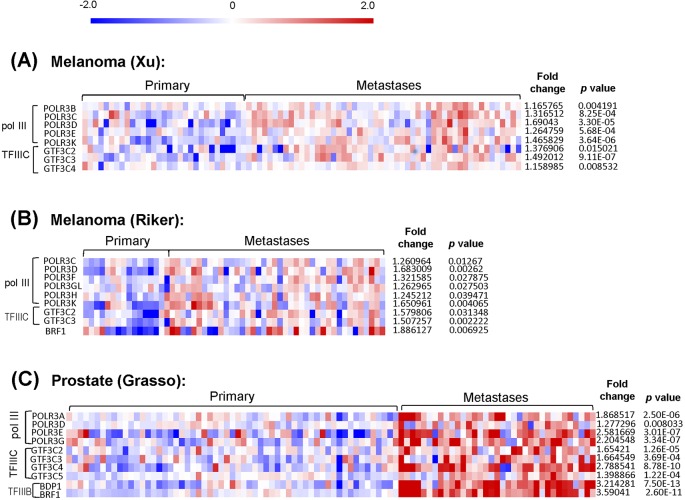
Fig. 6.
Pol III and its products are associated with invasion and metastasis. Heat maps from Oncomine data sets showing pol III (POLR3), TFIIIC (GTF3C) and TFIIIB (Brf1, BDP1) subunit mRNA expression in primary tumours versus patient-matched metastases in melanoma (Xu and Riker datasets; A,B) or prostate cancer (Grasso dataset; C). The heatmap scale bar is indicated at the top, and the average degree of upregulation of transcripts in metastasis and statistical significance values of these are tabulated on the right-hand side. In Oncomine, all data are normalised as follows: negative values were not included and all data were log2-transformed, median-centred per array, and the standard deviation was normalised to one per array. Depending on the type of microarray (one or two colours) data are presented either as log2 median-centered intensities (Xu and Riker), or log2 median-centered ratios (Grasso). The scale bar is log2.

