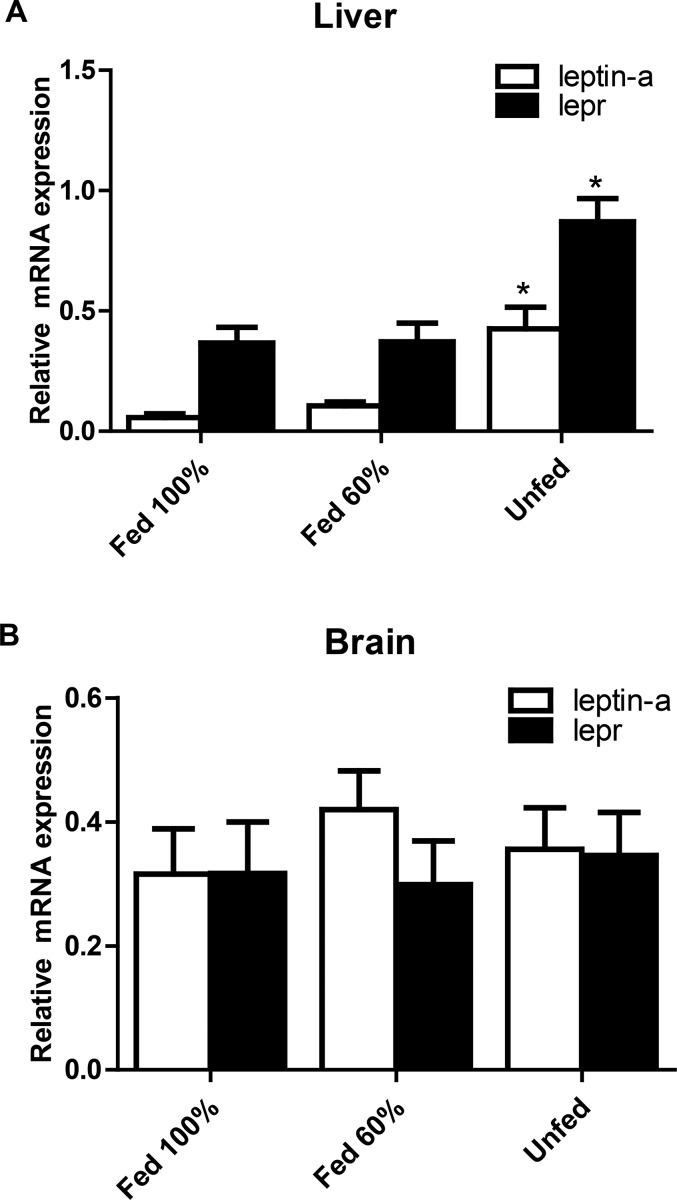
Fig. 4.
The expression of leptin-a and lepr mRNA of juvenile seahorses (Hippocampus erectus) under different food intake statuses for 7 days. (A) Liver, (B) brain (n=8). mRNA levels were qualified by real-time PCR. Asterisks denote significant differences between the different food intake statuses (P<0.05; one-way ANOVA followed by the Duncan's multiple-range tests).

