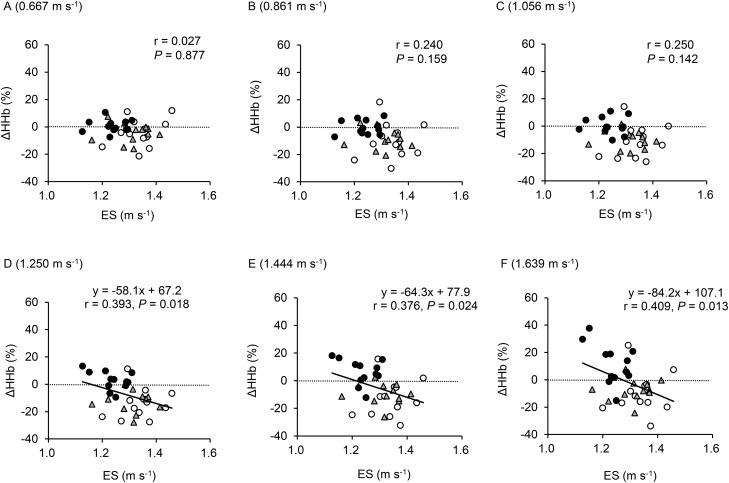
Fig. 4.
Relationships between an individual's ES and delta changes in HHb between standing baseline and last 1-min data at each gait speed. Data are pooled in all oxygen concentrations (n=36). Data points indicate normoxia (○), moderate hypoxia (△), and severe hypoxia (●).Gait speed of (A) 0.667 m s−1; (B) 0.861 m s−1; (C) 1.056 m s−1; (D) 1.250 m s−1; (E) 1.444 m s−1; and (F) 1.639 m s−1.

