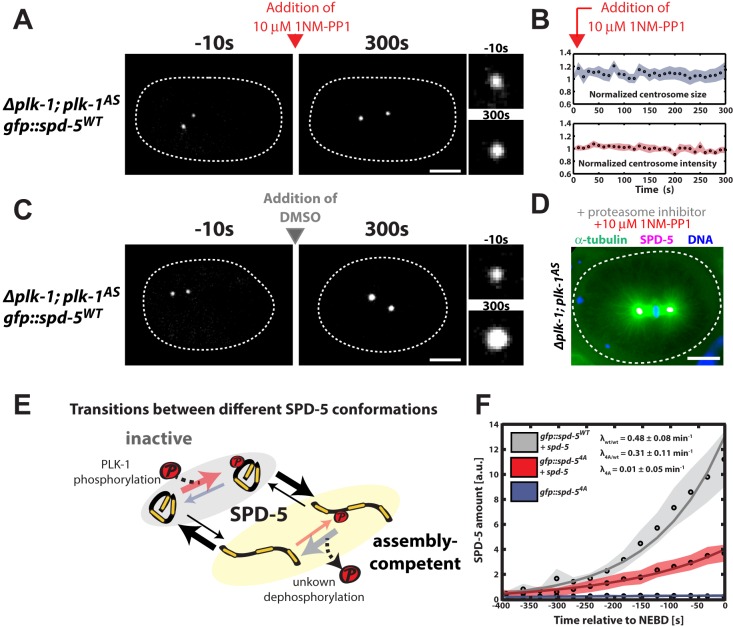
Fig. 4.
A PLK-1 dependent SPD-5 conversion model can explain in vivo PCM assembly. (A) plk-1AS embryos expressing GFP::SPD-5WT were visualized by fluorescence confocal microscopy (white dashed line is embryo outline). 10 µM 1-NM-PP1 (PLK-1AS inhibitor) was added to permeabilized embryos prior to mitotic entry (red arrow). Insets on the right represent zoomed-in images of a centrosome. Scale bar: 10 µm. (B) Quantification of centrosome size and fluorescence intensity of GFP::SPD-5WT at centrosomes from A (n=10 centrosomes). Circles represent mean values and shaded areas represent s.e.m. (C) Same as in A, except that DMSO was added instead of the PLK-1AS inhibitor. Centrosomes continued to grow as expected. Scale bar: 10 µm. (D) plk-1AS embryos were treated with 10 µM 1-NM-PP1 and 20 µM c-lactocystin-β-lactone for 20 min to arrest cells in metaphase, then frozen and fixed in methanol. Tubulin, SPD-5 and DNA were visualized by immunofluorescence. Centrosomes continued to nucleate microtubules in the absence of PLK-1 activity. Scale bar: 10 µm. (E) Possible transitions between the different conformations of SPD-5. (F) Total centrosomal SPD-5 amount fit with the accumulation model to determine SPD-5 incorporation rates. Circles represent mean values and shaded areas represent s.e.m. from experimental data. Solid lines represent the fits. λwt/wt, λ4A/wt and λ4A denote SPD-5 incorporation rates obtained from fit for each condition.

