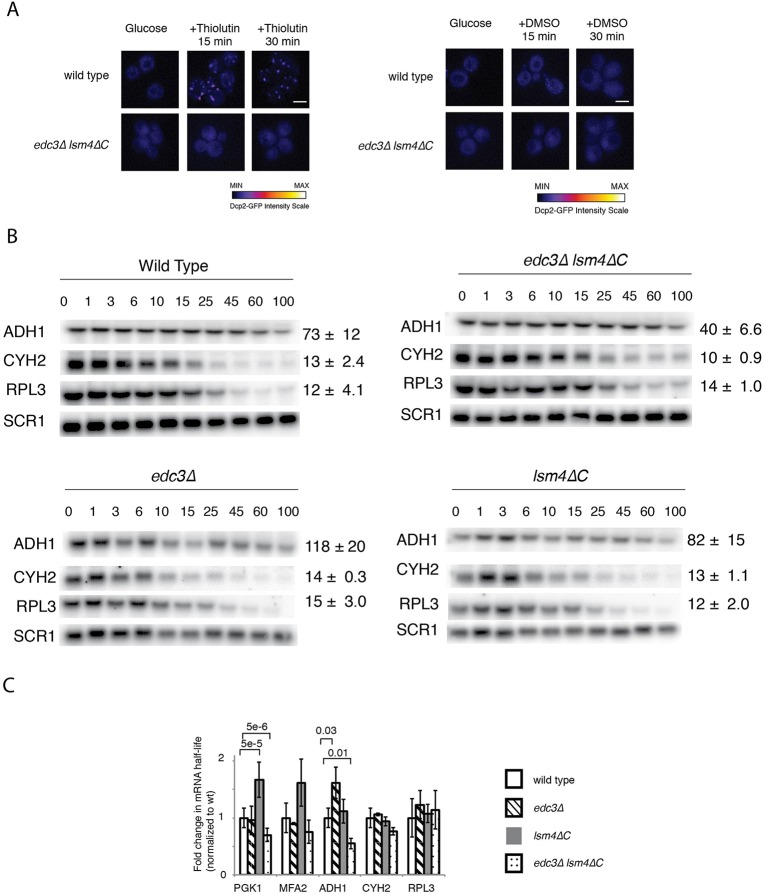
Fig. 2.
Multiple mRNAs are destabilized in the edc3Δ lsm4ΔC mutant. (A) Left: wild type and edc3Δ lsm4ΔC mutant yeast cells expressing Dcp2-GFP from its endogenous locus grown in SC+2% glucose after transcription was inhibited by thiolutin. Right: cells treated with DMSO alone. The images were plotted to the same contrast range and the scale bars represent 3 µm. Intensity of the GFP signal is indicated below. (B) Northern blots for ADH1, CYH2/RPL28 and RPL3 mRNA performed after thiolutin transcriptional shut-off. Error=s.d., n=3 biological replicates. Quantification of mRNA half-lives for mRNA normalized to SCR1 as a loading control. Time points (min) are shown above the respective northern blots. (C) Quantification of mRNA half-lives for mRNA normalized to wild type half-life for each mRNA for the mRNA indicated. Statistically significant pairings according to a two-tailed t-test indicated with their P values.

