Fig. 6.
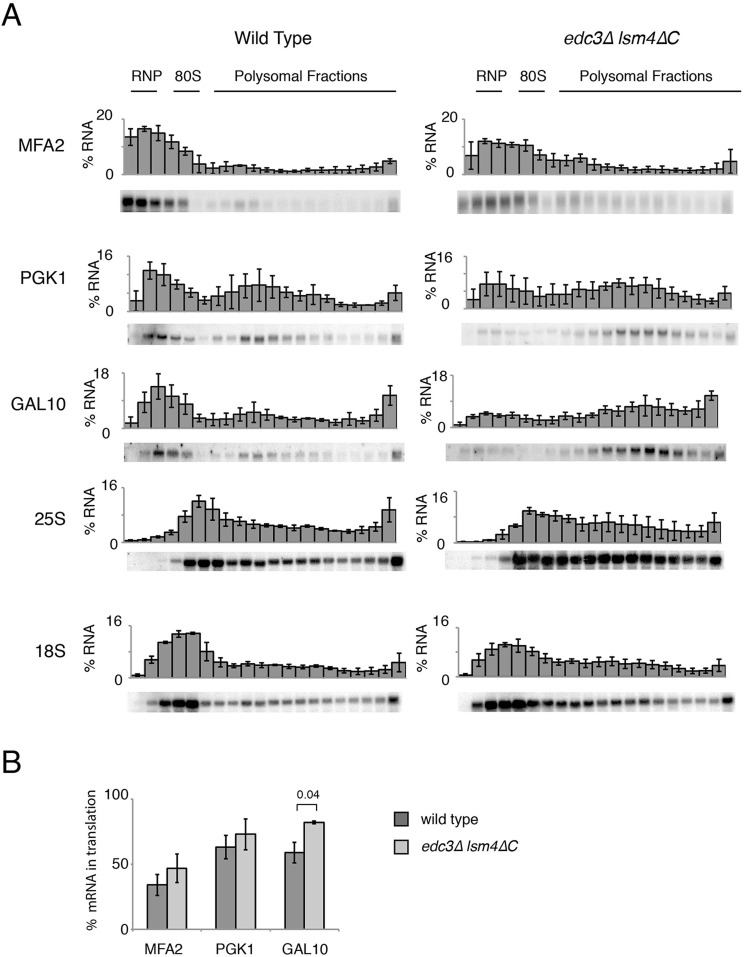
Sucrose gradient distribution of mRNA and ribosomal subunits for wild-type and the edc3Δ lsm4ΔC strains. (A) Northern blot analysis of fractions from a sucrose gradient after ultracentrifugation for the wild-type and edc3Δ lsm4ΔC strains. Each panel indicates the mRNA probed, a representative northern and quantification of intensity in each fraction (error bars indicate standard deviation, n=3 biological replicates). Yeast grown in standard yeast extract/peptone medium (YEP) supplemented with 2% galactose. (B) Quantification of the percentage of the indicated mRNAs in the translating fractions (80S and polysomal). Error bars indicate standard deviation. Significant P value is indicated as determined by t-test.

