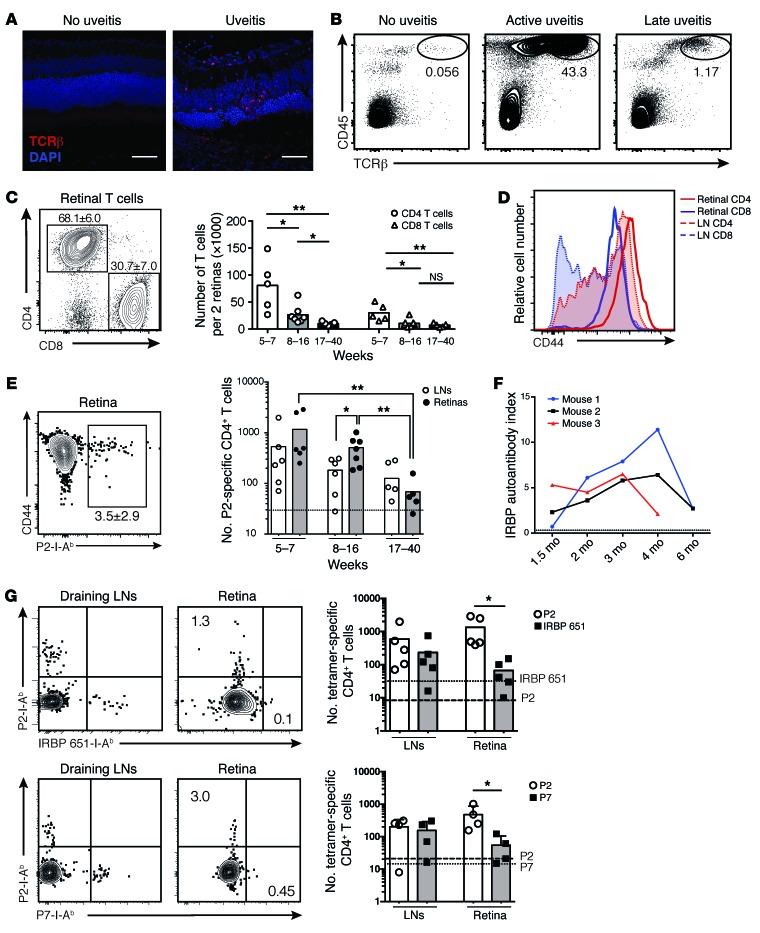
Figure 3. Activated IRBP-specific T cells infiltrate the retinas of AireGW/+ Lyn–/– mice with uveitis.
(A) Immunostaining of retinas from AireGW/+ Lyn–/– mice showing infiltration of TCRβ+ T cells (red) in mice with uveitis (original magnification, ×40; scale bars: 50 μm). Data are representative of 2 independent experiments. (B–E) Analysis of total and IRBP-specific T cells in mice with uveitis. Plots are representative of 3 independent experiments with n = 3–5 mice per group; numbers shown indicate percentage of cells in gate. Graphs show data pooled from 3 independent experiments; each dot represents an individual mouse; bars represent mean. (B) CD45 and TCRβ expression on total live retinal cells. (C) CD4 and CD8 expression on CD45+TCRβ+ retinal T cells (left), and numbers of these cells in the retinas of mice of indicated ages (right). (D) CD44 expression on CD4+ and CD8+ T cells from indicated tissue. LN, lymph node. (E) Left: Frequency of retinal P2 tetramer–specific CD4+ T cells from mice in C. Right: Numbers of P2-specific cells in indicated tissue. Dashed line represents the limit of detection. (F) Anti-IRBP antibodies in the serum of AireGW/+ Lyn–/– mice with uveitis analyzed longitudinally. Dashed line represents the limit of detection. (G) Mice with active uveitis were analyzed for the presence of CD4+ T cells binding either P2 and IRBP 651–670 (“IRBP 651”; top) or P2 and P7 (bottom) epitopes of IRBP in the indicated tissue. Plots show representative costaining; numbers indicate percentage of cells in gate, quantified on the right. Each dot represents an individual mouse; bars show mean. Dashed line represents the limit of detection for the P2 tetramer; dotted line represents the limit of detection for the IRBP 651 (top) or P7 (bottom) tetramer. Data are pooled from 2 independent experiments. *P < 0.05, **P < 0.01, Mann-Whitney test (C, E, and G).

