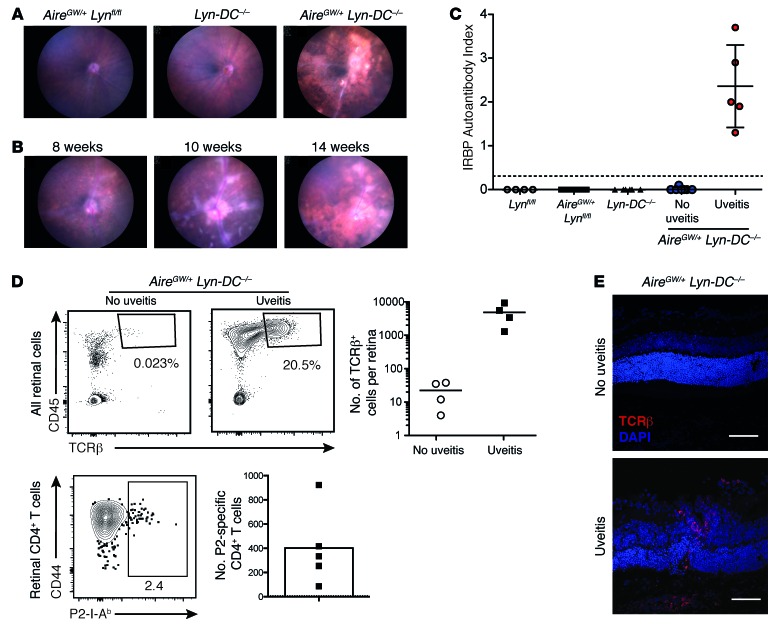
Figure 4. AireGW/+ Lyn-DC–/– mice develop uveitis that is accompanied by an anti-IRBP immune response.
(A) Representative funduscopic images of 3- to 6-month-old mice of indicated genotypes showing retinal disease in a subset of the AireGW/+ Lyn-DC–/– mice. (B) Time course of funduscopic changes in an AireGW/+ Lyn-DC–/– mouse with uveitis (representative of n = 3 mice with uveitis analyzed longitudinally). (C) Anti-IRBP antibody levels in the serum of 2- to 6-month-old AireGW/+ Lyn-DC–/– mice with (n = 5) and without uveitis (n = 7) were measured. Control mice analyzed consisted of Lynfl/fl (n = 8), AireGW/+ Lynfl/fl (n = 15), and Cd11c-Cre Lynfl/fl (n = 10). Each dot represents an individual mouse; the horizontal lines show mean ± SD; the dashed line represents the limit of detection. (D) Left set of panels: Plots of retinal cell populations from AireGW/+ Lyn-DC–/– mice with or without uveitis. Single-cell suspensions from retinas of individual mice were analyzed for CD45+TCRβ+ T cells (top) and P2 tetramer–specific CD4 T cells (bottom). Numbers shown indicate percentage of cells in gate. Right set of panels: Calculated total numbers of the indicated cells per retina. Each dot represents an individual mouse, and the horizontal lines show mean. The dashed line represents the limit of detection, calculated as in Figure 2. Data are representative of at least 3 independent experiments. (E) Confocal imaging of retinal sections of AireGW/+ Lyn-DC–/– mice with or without uveitis showing infiltration of TCRβ+ T cells (red) in mice with disease (original magnification, ×40; scale bars: 50 μm). Data are representative of 2 independent experiments.

