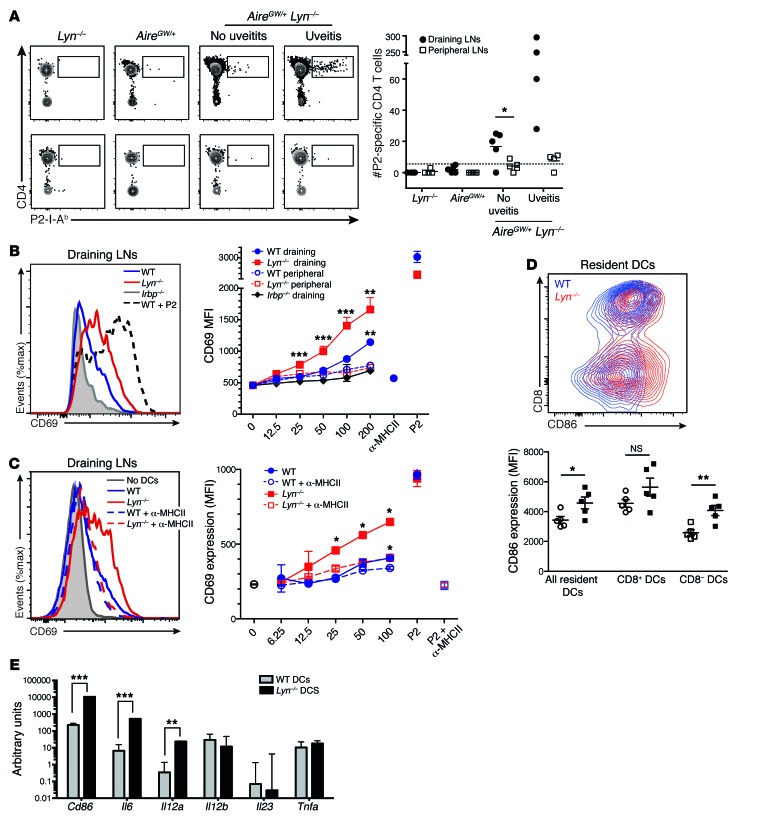
Figure 5. LYN-deficient DCs from the eye-draining lymph nodes present more IRBP and lead to increased priming of IRBP-specific T cells.
(A) Left: Representative plots showing P2-specific CD4+ T cells in the eye-draining LNs (top) or in pooled peripheral LNs (bottom) from 15- to 20-week-old mice of indicated genotypes, quantified on the right. Each dot represents an individual mouse; horizontal lines show mean; dashed line represents the limit of detection. Data are pooled from 3 independent experiments. (B and C) Fifty thousand P2-specific T cell hybridomas cocultured overnight with DCs from either eye-draining or peripheral LNs from mice of indicated genotypes were analyzed by flow cytometry for CD69 upregulation. As a positive control, 0.1 μg/ml P2 peptide was added. (B) Left: CD69 upregulation by hybridomas cocultured with 200,000 eye-draining LN DCs. Right: CD69 expression (mean fluorescence intensity [MFI]) on hybridomas cocultured with varying numbers of DCs from either eye-draining (filled symbols) or peripheral (open symbols) LNs. As a negative control, anti-MHCII blocking antibody was added to hybridomas cocultured with 200,000 WT DCs. (C) Left: Effects of MHCII blockade on CD69 upregulation by hybridomas cocultured with 100,000 draining LN DCs, quantified over a range of DC concentrations (right). (D) Left: Representative flow cytometry plots showing CD86 and CD8 expression by resident (CD11c+MHCIIint) WT and Lyn–/– cervical LN DCs. Right: CD86 expression on indicated DC populations. Each dot represents an individual mouse; horizontal lines show mean ± SD. (E) Relative cytokine mRNA expression in WT and Lyn–/– sorted resident (CD11c+MHCIIint) LN DCs, normalized to GAPDH, and shown as arbitrary units. Data are representative of at least 3 (B–D) or 2 (E) independent experiments (4–6 mice per group). *P < 0.05, Mann-Whitney test (A). *P < 0.05, **P < 0.01, ***P < 0.001, 1-way ANOVA (B and C). *P < 0.05, **P < 0.01, ***P < 0.001, unpaired 2-tailed Student’s t test (D and E).

