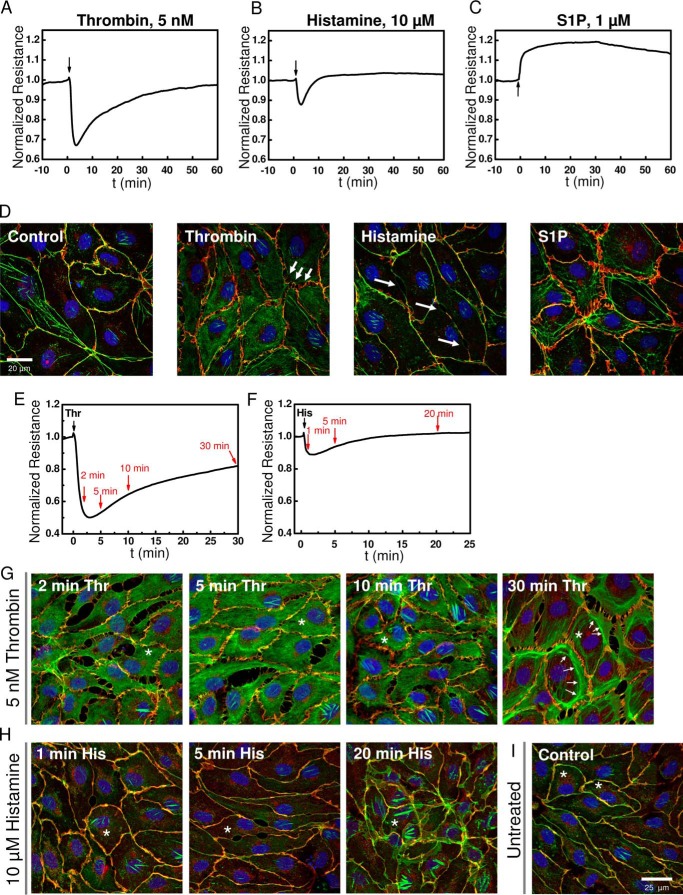
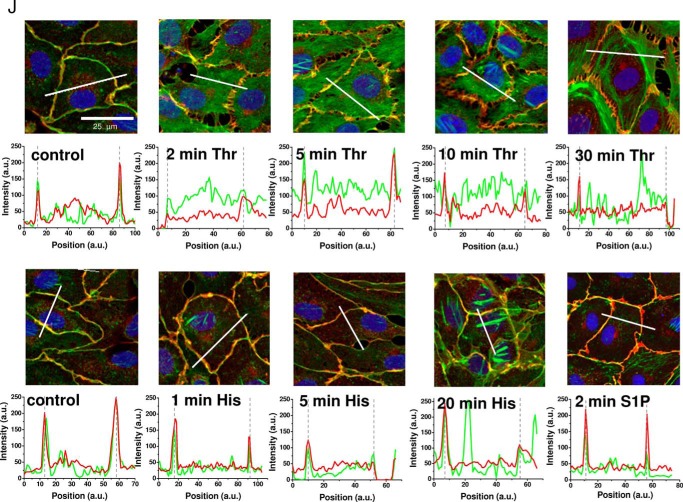
FIGURE 1.
Typical responses of HDMEC to GPCR agonists thrombin, histamine, and S1P. A–C, electrical resistance of confluent HDMEC cell layers after stimulation with 5 nm thrombin (A), 10 μm histamine (B), and 1 μm S1P (C) where indicated by arrows. Electrical resistance was normalized to the last values before agonist addition. Absolute baseline resistances were 4202 Ω (A), 3841 Ω (B), and 2198 Ω (C). Note that for thrombin and histamine stimulation, mature HDMEC cell layers were used after 4 days in culture, whereas S1P experiments were intentionally conducted with cell layers after 2 days in culture, which explains the lower initial baseline resistance. S1P experiments were performed in less mature HDMEC monolayers to better resolve S1P-mediated enhancement of barrier function. D, confocal fluorescence images of confluent HDMEC cell layers 2 min after stimulation with thrombin, histamine, or S1P compared with the control. The cells were stained for VE-cadherin (red), actin (green), and Hoechst 33342 (blue). E–I, kinetics of changes in HDMEC cell layer morphology and junctions after 5 nm thrombin and 10 μm histamine stimulation were followed at different time points as indicated by red arrows in ECIS traces (E and F). Thrombin and histamine addition, respectively, is indicated by black arrows. Distribution of VE-cadherin and actin is shown for the selected time points after thrombin (G) or histamine (H) stimulation and compared with an untreated control (I). The white arrows point to areas with increased amount of actin bundles and fiber structures. Asterisks indicate cells used for quantification of actin and VE-cadherin distribution in J. J, quantification of actin (green traces) and VE-cadherin (red traces) fluorescence after thrombin, histamine, or S1P stimulation. Intensity histograms (in arbitrary units, a.u.) were generated for the green (actin) and red (VE-cadherin) fluorescence channel images as function of pixel position (a.u.) along cell cross-sections indicated by the white solid lines drawn into the corresponding fluorescence image. Within the intensity plots, cell borders are indicated by dashed lines.


