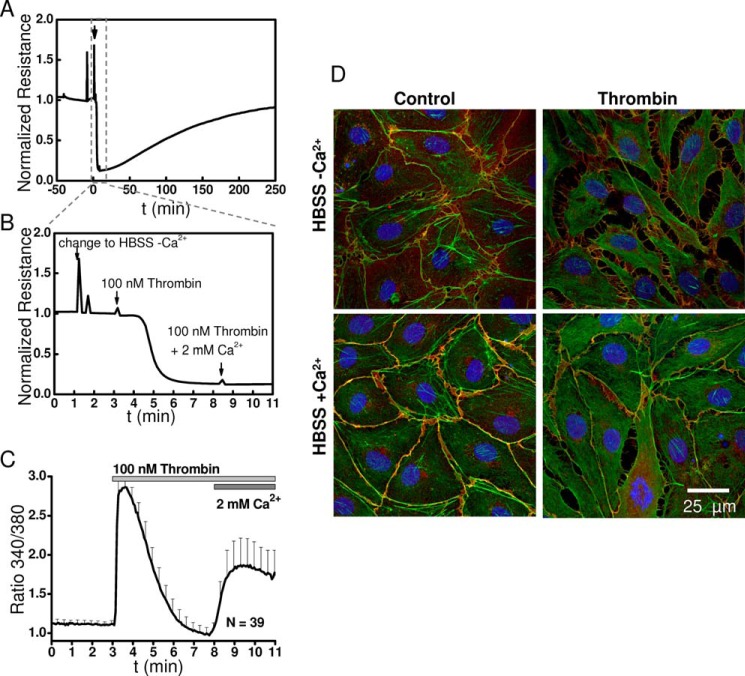
FIGURE 10.
Changes in HDMEC monolayer resistance in response to thrombin in Ca2+-free and Ca2+-containing HBSS. A, time course of changes in HDMEC monolayer electrical normalized resistance upon addition of 100 nm thrombin in Ca2+-free extracellular HBSS and subsequent restoration of 2 mm Ca2+ to the extracellular solution. The arrow indicates time point of change to Ca2+-free HBSS. B, close-up of A showing with three consecutive arrows the time of switch to Ca2+-free HBSS (−Ca2+), addition of thrombin at 100 nm in Ca2+-free HBSS and change to HBSS containing 2 mm Ca2+ (+Ca2+). For this specific experiment, specialized ECIS arrays were used (2W4 × 1E PC). These arrays had wells with the same dimensions as the chambers used for Ca2+ imaging, and ECIS measurements were performed at room temperature. C, corresponding Ca2+ imaging trace upon addition of 100 nm thrombin using the same −Ca2+/+Ca2+ protocol. D, corresponding immunofluorescence staining of VE-cadherin (red), actin (green) and nuclei stain Hoechst (blue) on cells stimulated for 2 min with 100 nm thrombin in the Ca2+-free (upper panels) and Ca2+-containing (lower panels) HBSS.

