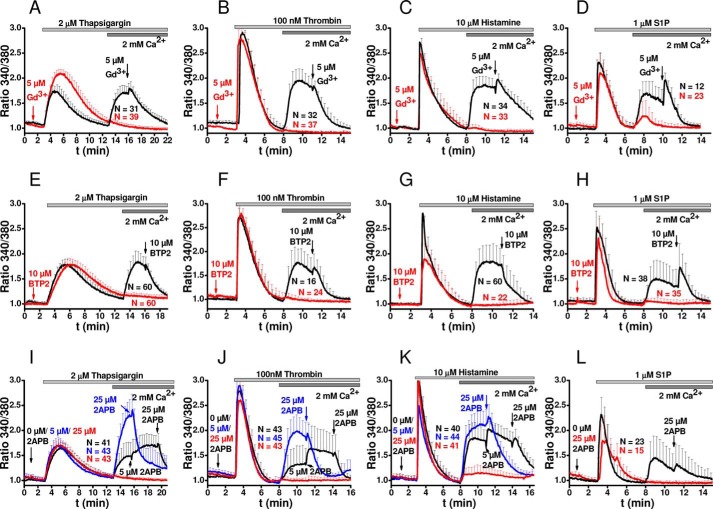
FIGURE 2.
SOCE inhibitors inhibit thapsigargin-, thrombin-, histamine-, and S1P-activated Ca2+ entry in HDMEC. Fura-2 recordings showing changes in intracellular free Ca2+ concentrations represented as ratio 340/380 (mean ± S.D.) after stimulation with 2 μm thapsigargin (A, E, and I), 100 nm thrombin (B, F, and J), 10 μm histamine (C, G, and K), and 1 μm S1P (D, H, and L). Effect of 2 min of preincubation with 5 μm Gd3+ (A–D, red traces) on changes in intracellular free Ca2+ mobilization compared with controls (black traces) after stimulation with 2 μm thapsigargin (A), 100 nm thrombin (B), 10 μm histamine (C), and 1 μm S1P (D). In the control black traces, 5 μm Gd3+ was added after Ca2+ entry reached a plateau. E–H, effects of 2 min of preincubation with 10 μm BTP2 (red traces) on changes in intracellular free Ca2+ mobilization compared with controls (black traces) after stimulation with 2 μm thapsigargin (E), 100 nm thrombin (F), 10 μm histamine (G), and 1 μm S1P (H). In the control black traces, 10 μm BTP2 was added after Ca2+ entry has reached a plateau. I–L, effects of 2 min of preincubation with 25 μm 2-APB on Ca2+ mobilization induced by thapsigargin (I), thrombin (J), histamine (K), and S1P (L) compared with controls (black traces). In the control black traces and after Ca2+ entry has reached a plateau, 5 μm 2-APB was added first to cells followed by 25 μm 2-APB to assess potentiation of Ca2+ entry with 5 μm 2-APB and subsequent inhibition with 25 μm 2-APB. In the blue traces, a 2-min preincubation with 5 μm 2-APB was performed to reveal potential enhancement of Ca2+ entry followed by addition of 25 μm 2-APB after Ca2+ entry has reached a plateau. The data are represented as means ± S.D., and the number of cells/condition is depicted in each figure panel and color-coded for each trace.

