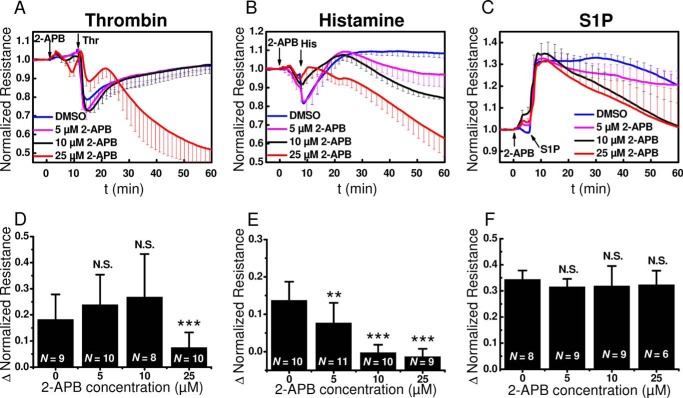
FIGURE 6.
2-APB effects on barrier function in response to thrombin, histamine and S1P. A–C, changes in electrical resistance after stimulation with thrombin (A), histamine (B), and S1P (C) in the presence of 5 μm (magenta), 10 μm (black), or 25 μm (red) 2-APB compared with controls (blue). The data represent means ± S.D. from 3–6 independent wells (2-APB; thrombin: n = 4, except for 0 μm 2-APB, where n = 3, histamine: n = 6, S1P: n = 6 for all 2-APB concentrations). D–F, quantification of the maximum change in normalized resistance (Δ Normalized Resistance) upon thrombin (D), histamine (E), and S1P (F) stimulation in the absence or presence of 5, 10, or 25 μm 2-APB are shown. The data are represented as means ± S.D. from 6–11 independent experiments as marked in the bar graphs.

