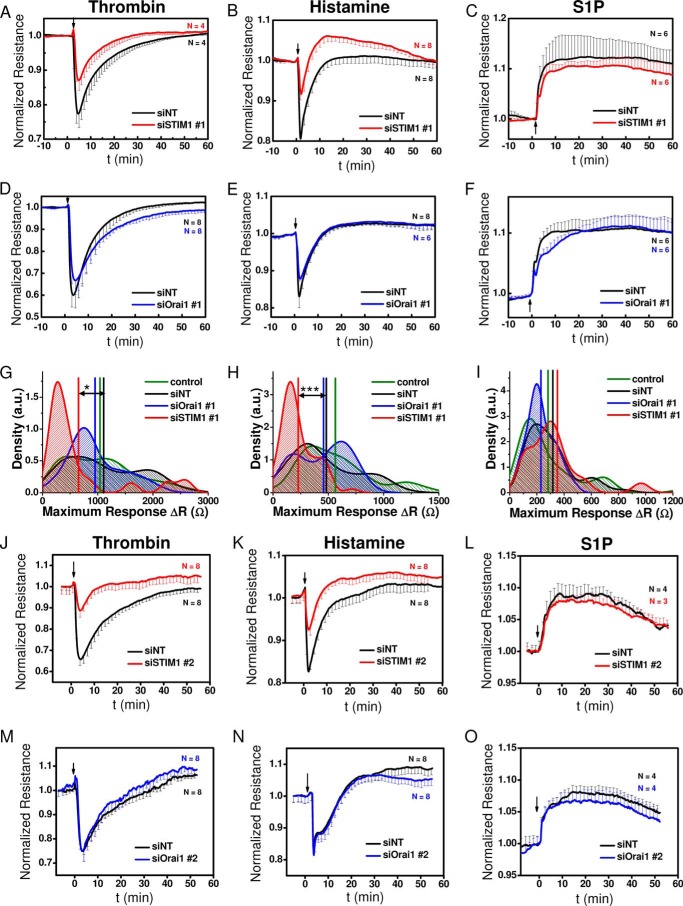
FIGURE 9.
Effect of STIM1 and Orai1 knockdown on changes in HDMEC cell layer resistance upon stimulation with thrombin, histamine, and S1P. A–C, changes in resistance of HDMEC monolayers transfected with either siSTIM1 #1 (red traces) or control siNT (black traces) before and after stimulation (indicated by arrow) with 5 nm thrombin (A), 10 μm histamine (B), and 1 μm S1P (C). D–F, changes in resistance of HDMEC monolayers transfected with either siOrai1 #1 (blue traces) or control siNT (black traces) before and after stimulation with 5 nm thrombin (D), 10 μm histamine (E), and 1 μm S1P (F). All traces shown are from representative experiments reflecting averages ± S.D. of n = 4–8 wells/condition as indicated in the respective plots. G–I, density plots with statistical analysis on a large set of experiments similar to those in A–F performed on HDMEC monolayers transfected with siSTIM1 #1, siOrai1 #1, siNT, and control non-transfected cells and stimulated with thrombin (G), histamine (H), and S1P (I). The data are from 4–10 independent HDMEC isolations and reflect 23–86 independent wells/experimental condition. Density plots represent the relative distribution of the maximum response intensities to agonist addition. Maximum response intensities were quantified as the difference in resistance between baseline and the maximal response obtained after GPCR stimulation, ΔR (Ω). For all agonists, responses are shown as positives. Density plots were generated by Kernel density smoothing for histograms. High densities indicate frequent occurrence of these values. In addition to HDMEC populations treated with siNT, data of siRNA-untreated cells (control) were also included. Vertical lines represent the mean response intensity (G: siNT: 1107 Ω, siOrai1: 951 Ω, siSTIM1: 652 Ω, control: 1040 Ω; H: siNT: 482 Ω, siOrai1: 457 Ω, siSTIM1: 228 Ω, control: 564 Ω; I: siNT: 317 Ω, siOrai1: 229 Ω, siSTIM1: 351 Ω, control: 282 Ω). The data were subjected to ANOVA analysis, and significant differences are indicated by asterisks as described under “Experimental Procedures.” J–O, changes in resistance of HDMEC monolayers transfected with siSTIM1 #2 (J–L, red traces) or siOrai1 #2 (M–O, blue traces) compared with control siNT (black traces) before and after stimulation (indicated by arrow) with 5 nm thrombin (J and M), 10 μm histamine (K and N), or 1 μm S1P (L and O). All traces shown are from representative experiments reflecting averages ± S.D. of n = 4–8 wells/condition.

