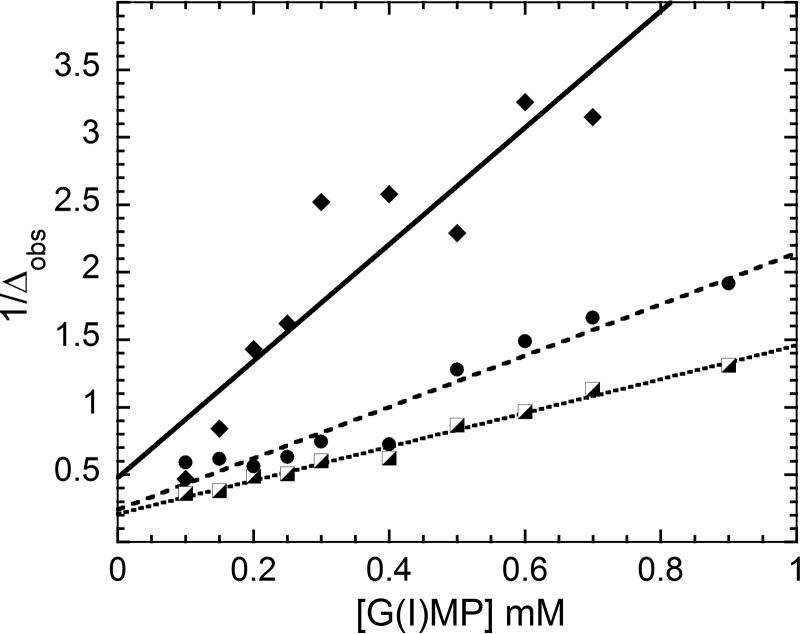
FIGURE 3.
Changes in the line width of GMP and IMP protons in the presence of GMPR and NADP+. The plot shows the reciprocal of the change in ligand line width with an increase of [L]0 (total ligand concentration) at constant protein and NADP+ concentrations: GMP H8 (8.1 ppm; filled diamonds); IMP, H2 (8.5 ppm; half-filled squares) and H8 (8.1 ppm; filled circles). Here line width is defined as a full width of the 1H resonance at half-height as measured at 800 MHz.

