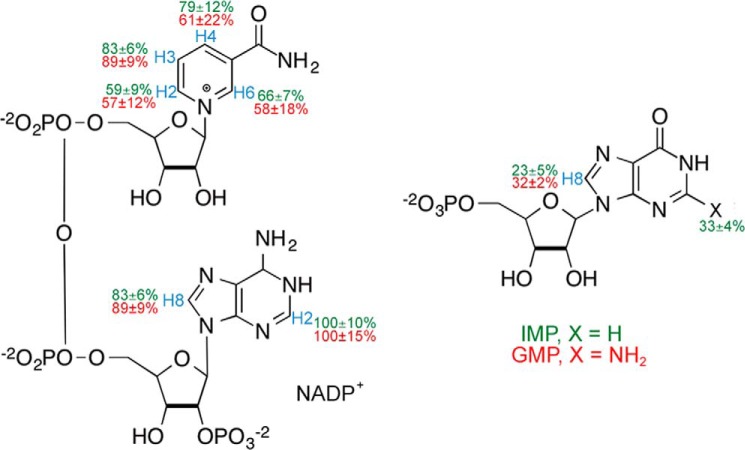
FIGURE 4.
Epitope mapping of G(I)MP and NADP+. STD-NMR results for 2 mm IMP/GMP and NADP+ in the presence of 40 μm GMPR. Protons are labeled in blue. The relative degree of saturation of the individual hydrogens is mapped onto the structure and normalized to the largest STD intensity of hydrogen H2 for adenosine for E·IMP·NADP+ (X = H, green) and E·GMP·NADP+ (X = NH2, red). For more explanation, see “Experimental Procedures.”

