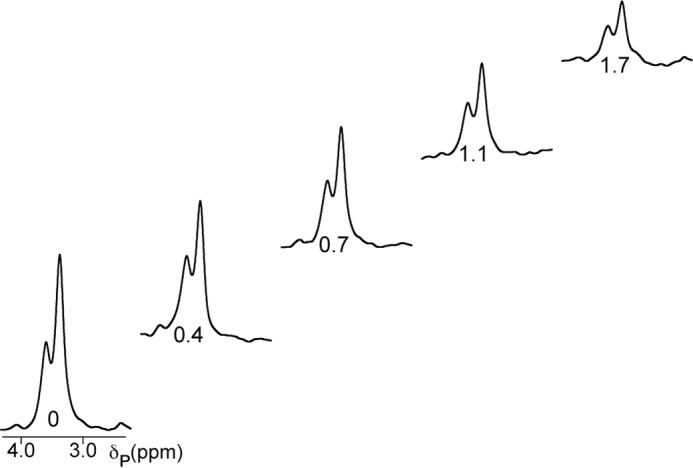
FIGURE 5.

31P spectra from the R1 experiment at 0.2 T for the NADP+ diphosphate resonances. The sample contains 0.4 mm GMPR, 1.6 mm GMP, and NADP+ in 75 mm Tris-HCl, pH 7.8. The relaxation delay time in seconds spent at 0.2 T is shown below each spectrum.
