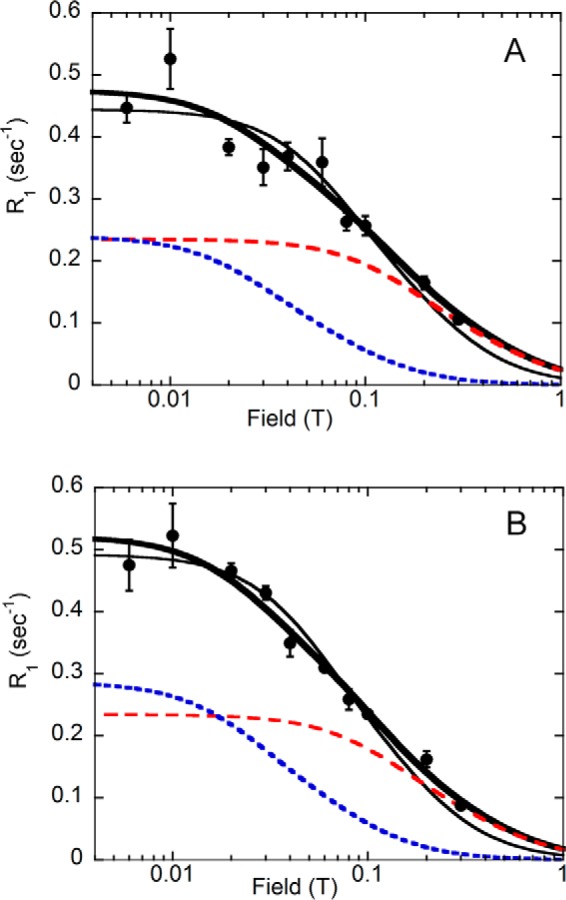
FIGURE 8.

Magnetic field dependence of R1 for NADP+31P in the E·GMP·NADP+ complex. NADP+ diphosphates are shown in A, and the NADP+ monophosphate is shown in B. The thin line represents a fit to Equation 6 with a single correlation time (37 and 45 ns for the diphosphate and monophosphate, respectively) and R0 of 0.5 and 0.6 s−1 for the di- and monophosphates, respectively. The thick line represents the best fit with Equation 1 and Equation 2, which describe two distinct dipolar contributions to the observed cofactor 31P R1: 1) a lower field component (blue dashed line) characterized by a long correlation time and R0 consistent with overall rotation of the protein complex with values taken from the E·IMP·NADP+ complex (Table 1) and 2) a second contribution (red dashed line) with a shorter correlation time (16 ns) and reduced R0 values (0.28 and 0.26 s−1 for the di- and monophosphates) that dominates the relaxation around 0.1 T. The parameter F, the fractional contribution of the slower τ, was found to be 0.16 and 0.10 for the diphosphate and monophosphate, respectively. Error bars, S.E.
