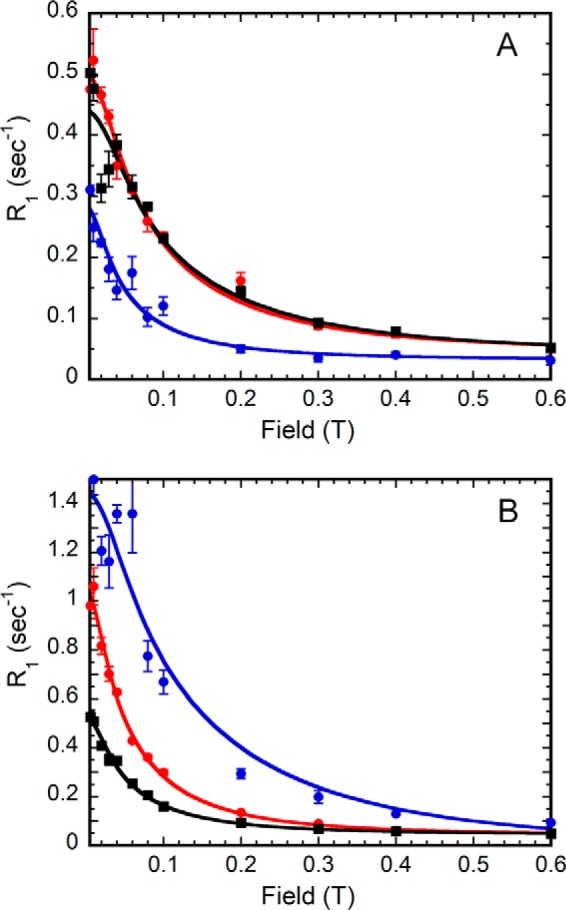
FIGURE 9.

Comparison of field dependence profiles of 31P in substrate and cofactor in each E·NADP+ ternary complex. For the E·GMP·NADP+ (A) and E·IMP·NADP+ (B) profiles, substrate monophosphate is blue, NADP+ monophosphate is red, and NADP+ diphosphates are black. Error bars, S.E.
