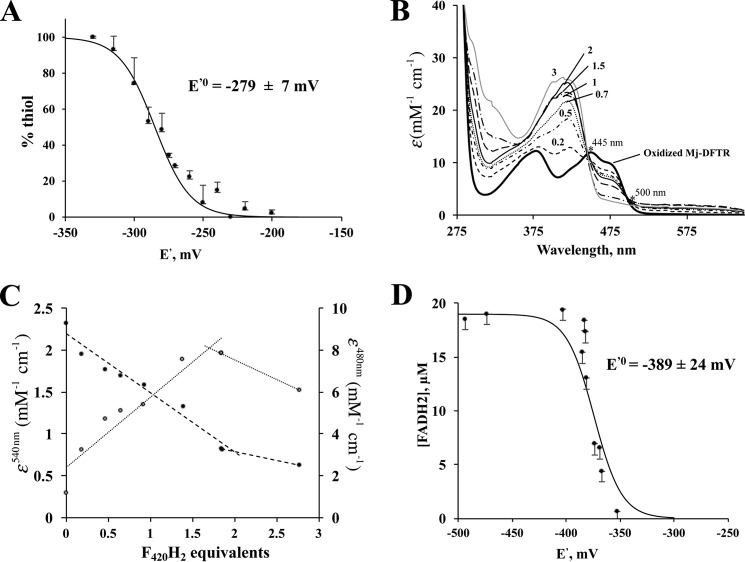
FIGURE 7.
Redox titration of active site Cys-disulfide-dithiol and bound flavin of Mj-DFTR. Each data point in A, C, and D or each spectrum in B represent an average from three independent measurements. Consequently, each error bar shown is for three independent measurements. In each case the dataset from one biological replicate is shown. The E′0 values derived from two biological replicates (D) were similar (data not shown). A, redox titration of Cys-disulfide-dithiol: Oxidized Mj-DFTR (30 μm) was incubated in a series of solutions containing 100 mm MOPS buffer, pH 7.0, and set at varying potential (E′) values with mixtures of DTT and oxidized DTT at appropriate ratios. The total concentration of DTT and oxidized DTT was 5 mm. % thiol, portion of the Mj-DFTR molecules with the active site Cys residues at the thiol state was quantified via a fluorimetric assay for mBBr-labeled Cys-thiolate; the fluorescence intensity values for the fully oxidized and fully reduced preparations were set to 0 and 100%. B, UV-visible spectra of Mj-DFTR redox titration mixtures with F420H2 as a reductant. The titration of Mj-DFTR-bound FAD involved the addition of various amounts of F420H2 (at final concentrations of 5–115 μm) to a series of solutions containing oxidized Mj-DFTR (25 μm) and 100 mm potassium phosphate buffer, pH 7.0, inside an anaerobic chamber. The labels on the spectra (0.2, 0.5, 0.7, 1, 1.5, 2, and 3) are the amounts of added F420H2 presented in terms of equivalents with respect to the Mj-DFTR-bound FAD; the label “oxidized Mj-DFTR” is for zero F420H2. The isosbestic points that occurred at 445 and 500 are marked with asterisks. C, changes in extinction coefficient values at 480 (filled circles) and 540 nm (open circles) of the Mj-DFTR mixtures as described in B. D, redox titration of Mj-DFTR-bound FAD with dithionite in the presence of methyl viologen, a redox dye, as a reference. The concentration of Mj-DFTR-bound FAD in a mixture was determined from the respective A460 nm value. % FADH2, percentage of the bound flavin in the FADH2 state as calculated from the concentration of Mj-DFTR-bound FAD in a mixture with dithionite and that in a control mixture without dithionite. The E′0 value shown was obtained by fitting the plotted data to the Nernst equation for a 2-electron reduction reaction (n = 2) (see Equation 2).

