FIGURE 3.
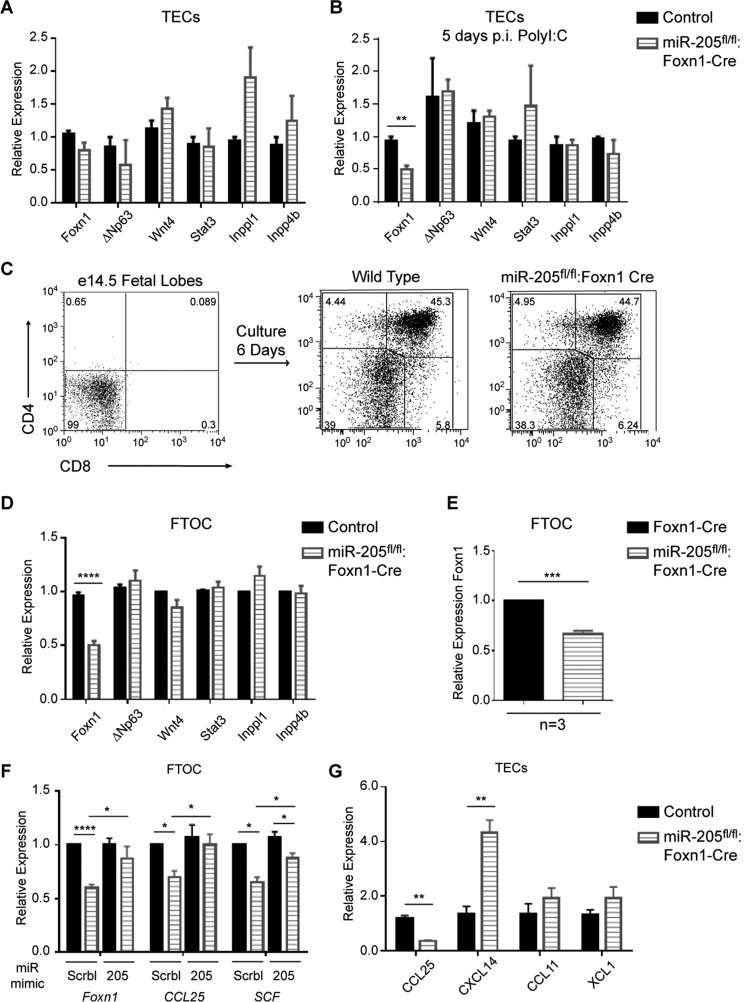
miR-205 positively regulates Foxn1 expression. A, RNA was prepared from purified TECs (CD45−EpCAM+MHCII+), isolated from thymii from 8-week-old control and miR-205fl/fl:Foxn1-Cre mice. Quantitative RT-PCR was used to assess the expression of Foxn1, ΔNp63, Wnt4, Stat3, Inppl1, and Inpp4b. B, RNA was isolated from CD45−EpCAM+MHCII+ sorted TECs 5 days p.i. of poly(I:C) from the indicated mice. Foxn1, ΔNp63, Wnt4, Stat3, Inppl1, and Inpp4b levels were compared using qPCR. C, FTOC were established for a 6-day period. CD4 and CD8 cell surface expression was measured by flow cytometry in E14.5 fetal thymic lobes at day 0 and after 6 days of culture using the indicated mice. D, quantitative RT-PCR was used to assess the expression of Foxn1, ΔNp63, Wnt4, Stat3, Inppl1, and Inpp4b in FTOCs from control and miR-205fl/fl:Foxn1-Cre mice after 6 days of culture. Control samples were normalized to one, with the relative mRNA expression calculated with 5 independently isolated samples. E, quantitative RT-PCR was used to compare Foxn1 expression in the Foxn1-Cre mice relative to the miR-205fl/fl:Foxn1-Cre line. Foxn1-Cre was normalized to one, and data were calculated from three independent experiments. F, FTOCs from the indicated mice were cultured in the presence of control miR mimics or miR-205 mimics. Six days post-culture, gene expression comparisons were undertaken with qRT-PCR. Control samples were normalized to one with the relative expression of the genes calculated using at least 3 independently isolated samples/gene. G, the relative expression of ccl25, cxcl14, ccl11, and xcl1 was determined by qRT-PCR with RNA isolated from sorted TECs as described in A. In A–F, relative expression was calculated by ΔΔCT normalized to the endogenous peptidylpropyl isomerase A levels, with 3 or more independent experiments performed in triplicate. *, p < 0.04; **, p < 0.006; ***, p < 0.0002; ****, p < 0.00001 (Student's t test). Data are representative of mean ± S.E. from at least 3 independent RNA samples.

