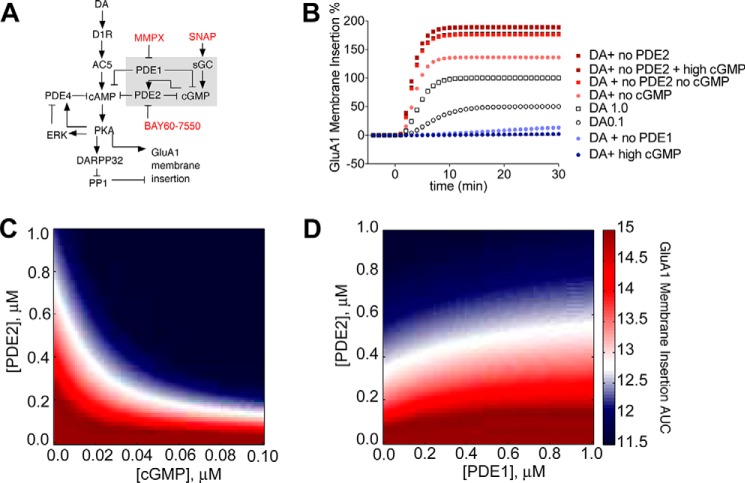
FIGURE 2.
Allosteric PDE2 activation by cGMP modulates GluA1 surface expression. A, diagram of model topology of PDE1/2 regulation of GluA1 surface insertion in D1R MSNs. Arrows and plungers indicate activation/production and inhibition/degradation, respectively. Species in red represent pharmacological agents used. B, cGMP level controls GluA1 surface insertion by enhancing PDE2 activity. Shown is a simulation comparison of GluA1 surface insertion time courses. C, varying cGMP and PDE2 concentrations affects GluA1 surface insertion. cGMP (x axis) and PDE2 (y axis) concentrations were varied from 0.0–1.0 μm. The resulting GluA1 surface insertion time courses were plotted, and the AUC value was calculated. AUC values were color-coded so that an increase over control (DA alone) is red, a decrease is blue, and a value equal to control is white. D, varying PDE1 and PDE2 concentrations affects GluA1 surface insertion. PDE1 (x axis) and PDE2 (y axis) concentrations were varied from 0.0–1.0 μm. AUC values are color-coded.

