Figure 2.
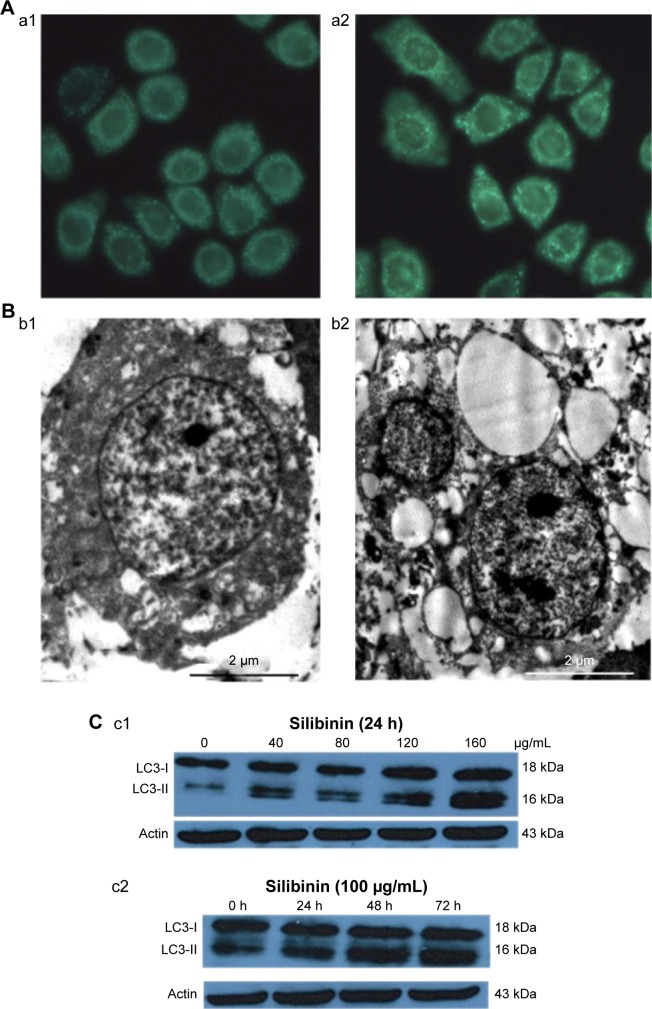
SIL induced the autophagy of the ACC-M cells.
Notes: (A) AVs detection by MDC staining (fluorescence microscope, ×200). (a1) The control group; (a2) the SIL-treatment groups, 80 µg/mL. (B) Ultrastructures of AVs by TEM. (b1) The control group: clear nucleoli, large nuclear/cytoplasm ratio, aside-shifted nucleoli, even cytoplasm matrix density (×5,000); (b2) AVs in the cells of the SIL-treatment group (×5,000). (C) Expression detection of LC3-I and LC3-II by Western blot. (c1) Expressions after cultured with different concentrations of SIL for 24 hours; (c2) expressions of LC3-I and LC3-II after 100 µg/mL of SIL acted on the ACC-M cells at different time periods.
Abbreviations: ACC-M, human lung high metastasis cell line of salivary gland adenoid cystic carcinoma; AVs, autophagic vacuoles; LC3, light-chain 3; MDC, monodansyl cadaverine; SIL, silibinin; TEM, transmission electron microscopy.

