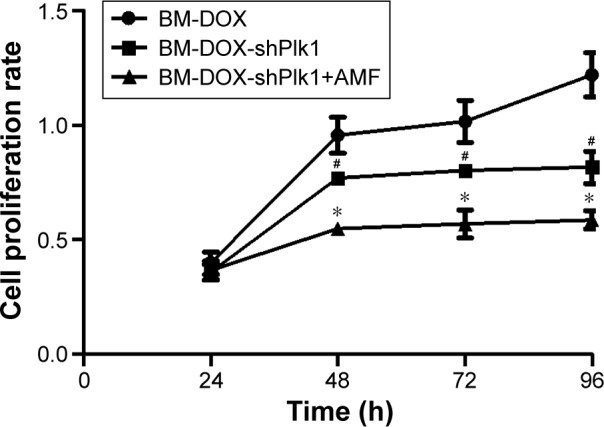
Figure 7.

U2-OS cell proliferation rates after different treatments.
Notes: Each value is represented as mean ± SD (n=6). #P<0.05 compared with BM-DOX group. *P<0.05 compared with BM-DOX-shPlk1 group.
Abbreviations: AMF, alternating magnetic field; BM, bacterial magnetosome; DOX, doxorubicin; Plk1, polo-like kinase 1; SD, standard deviation; shPlk1, recombinant eukaryotic plasmid pHSP70-Plk1-shRNA.
