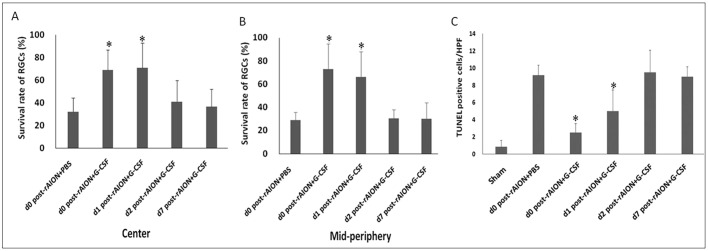
Fig. 3.
Survival rate of RGCs and apoptotic RGCs in rAION-induced rats with PBS treatment and G-CSF treatment on day 0, 1, 2 or 7 post-rAION induction. (A) The RGC survival rates of central retinas and (B) mid-peripheral retinas in each group were calculated as a percentage of the RGC density in the sham group. (C) Quantification of TUNEL-positive cells per high-power field (HPF). Data are expressed as mean±s.d. in each group (n=6). In the central retinas, the survival rates of the RGCs in the D0+G-CSF-treated group and D1+G-CSF-treated group were both 2.2-fold higher than that of the PBS-treated group (P=0.013 and P=0.020, respectively). In mid-peripheral retinas, the RGC survival rates in the D0+G-CSF-treated group and D1+G-CSF-treated group were 2.5-fold (P=0.005) and 2.3-fold (P=0.005) higher compared to the PBS-treated group. The numbers of TUNEL-positive cells/HPF in the D0+G-CSF-treated group and D1+G-CSF-treated group were 3.7- and 2.0-fold lower than that of the PBS-treated group, respectively (P=0.005, P=0.013). *P<0.05 compared with D0 PBS treatment by the Mann–Whitney U-test.

