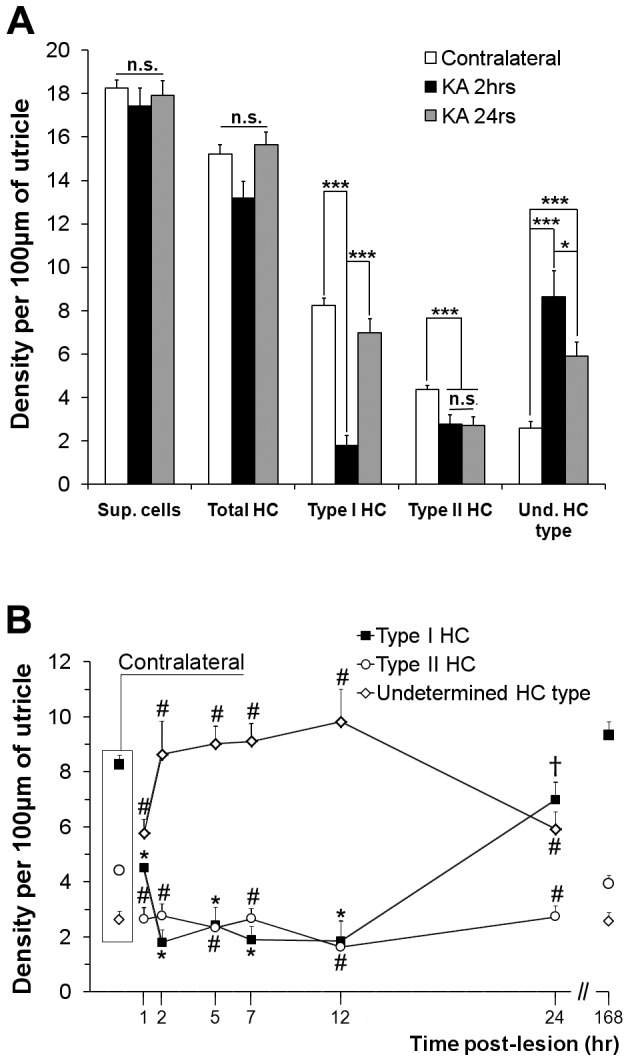
Fig. 4.

Density of hair cells and supporting cells in vestibular epithelia following the excitotoxic injury. Cells were counted on transverse semi-thin sections of utricles from three different experiments for each time point. Their density along a 100-µm length of epithelium is given. (A) Total numbers of supporting cells (Sup. cells), hair cells (total HC) and segregation between identified type I (type I HC), type II (type I HC) and undetermined hair cell type (Und. HC type) were compared with contralateral sections and at 2 h (KA 2 h) and 24 h (KA 24 h) post-lesion formation. Statistical significance between contralateral samples and the 2 h and 24 h time points following one-way ANOVA with post-hoc analysis using the Holm–Sidak method is shown. *P≤0.05, ***P≤0.001. n.s., not significant. (B) The density of identifiable and undetermined hair cell types was analyzed from 1 h to 168 h post-lesion formation in utricles and compared to those in contralateral ears, referenced as time 0 h for statistical analysis. Significance resulting from the ANOVA test followed by the Holm–Sidak method is presented. *P<0.001 vs 0 h, 24 h and 168 h; #P<0.001 vs 0 h and 168 h; †P<0.001 vs 168 h. Data are mean±s.e.m.
