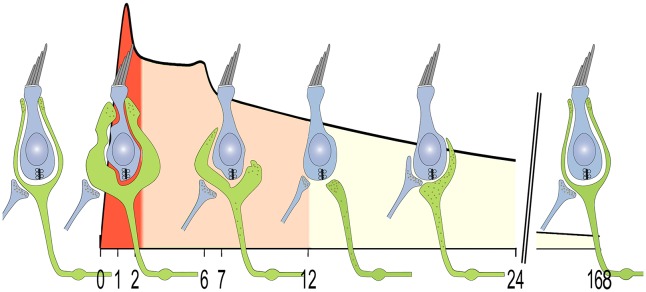
Fig. 9.
Illustration of the correlation between vestibular dysfunction and changes at the vestibular afferent terminals. Diagram shows the time course of behavioral vestibular dysfunctions induced by transtympanic injection of kainic acid (curve) and the change occurring at calyx terminals after excitotoxic injury (schematic cartoon of hair cells and afferents). The acute crisis peaking at 1.5 h followed by the progressive recovery period of the vestibular function parallels the lesion (red), terminal resorption (orange) and repair (yellow) of the afferent terminals. Replenishment of proteins associated with small synaptic vesicles is shown.

