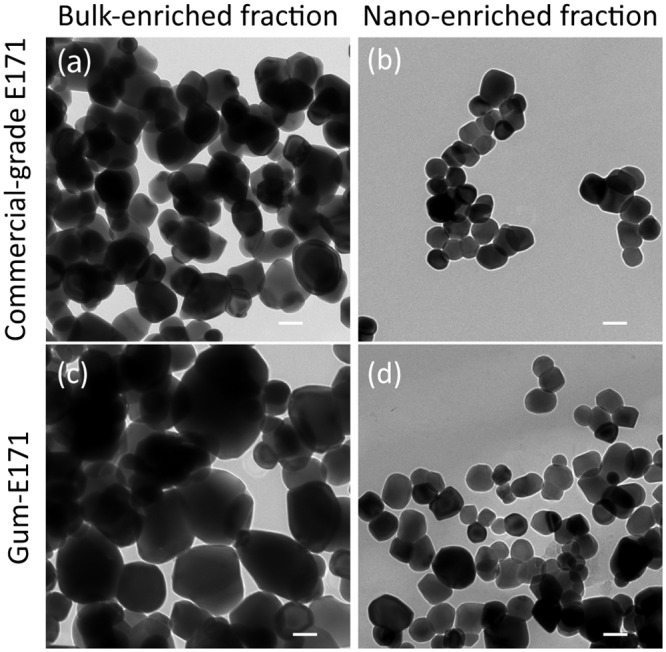
Fig 3. Primary particle analysis via TEM reveals a difference in size between nano- and submicron-enriched fractions after the sucrose step-gradient centrifugation procedure.

(a) Submicron-enriched commercial-grade E171 appear large compared to (b) the nano-enriched fraction. (c) Utilizing the same procedure on gum-E171 revealed a large, submicron-enriched fraction and (d) a small, nano-enriched fraction. All images are shown at identical magnification. The scale bar in the lower right corner of each micrograph is 100 nm.
