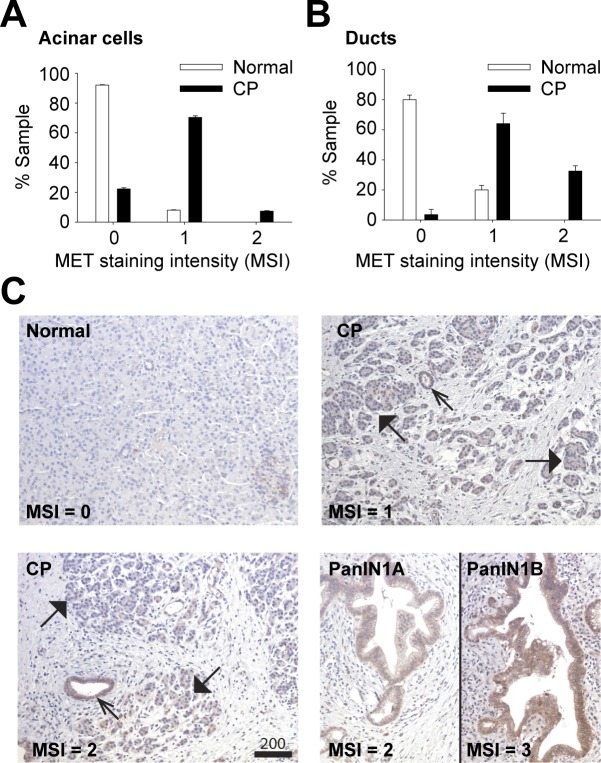
Fig 1. MET levels are increased in human CP.
Pancreatic samples from normal (n = 13) or CP patients (n = 16) were H&E and MET stained. MET levels in acinar cells (A) and ducts (B) were scored as MET Staining Intensity (MSI) using a semi quantitative scale (0–3) where 0 = baseline, 1 = low, 2 = medium, 3 = high MET levels (Scale, microns). C, representative images are shown for normal, CP and PanINs. MET-positive ducts (open arrows) and acini (closed arrows) are indicated.

