Abstract
Sphingosine-1-phosphate (S1P) is present in the blood plasma and acts as a pivotal intercellular signal transmitter in the immune system by recruiting lymphocytes from the thymus and secondary lymphoid tissues. The plasma S1P concentration is maintained by the supply of S1P from erythrocytes. Previously, we showed that S1P release from erythrocytes is mediated by an ATP-dependent transporter. In this study, we attempted to establish a rapid and reliable method for measuring the S1P transport activity in erythrocytes by using a fluorescent S1P analog, 7-nitro-2-1,3-benzoxadiazol-4-yl (NBD)-labeled S1P. NBD-S1P was released from erythrocytes in a time-dependent manner. The NBD-S1P release was reduced after exposure to glyburide, which is an inhibitor of the S1P transporter in erythrocytes. Moreover, the release of NBD-S1P and S1P from erythrocytes was competitively inhibited by intracellular S1P and NBD-S1P, respectively. These results showed that the erythrocyte S1P transporter exports NBD-S1P. We optimized the sample-preparation conditions and lipid extraction to increase the sensitivity of the assay. Furthermore, we successfully measured NBD-S1P release without lipid extraction by decreasing the concentration of BSA in the assay buffer to 0.1%. This method will be useful for the high-throughput screening of S1P transporter inhibitors using conventional fluorometers.
Keywords: lipid transfer proteins; sphingolipids; lysophospholipid; lipids/efflux; immunology; transporter; 7-nitro-2-1,3-benzoxadiazol-4-yl
Sphingosine-1-phosphate (S1P) is an immunomodulating agent present in the blood and lymph (1–4). Plasma S1P recruits lymphocytes from the thymus and secondary lymphoid organs to the circulatory system by activating S1P receptors on lymphocytes (5). Many components of blood, such as erythrocytes, platelets, and neutrophils, express sphingosine kinases and produce S1P (6). Platelets contain large amounts of S1P and release it only when activated by stimuli, such as thrombin, whereas erythrocytes constitutively release S1P in the absence of stimuli. Because erythrocytes constitute a large proportion of the blood cells in the body and because they lack S1P-degrading activity catalyzed by S1P lyase (SGPL1), S1P phosphatases (SGPP1 and SGPP2), and phospholipid phosphatases (PLPP1, PLPP2, and PLPP3) (7), they contribute substantially to plasma S1P. In addition to blood cells, endothelial cells constitutively release S1P into the blood without stimuli (8). Thus, plasma S1P is derived mainly from erythrocytes and endothelial cells (9). When the S1P supply from erythrocytes has been disrupted, the plasma S1P level and the number of the lymphocytes in the blood decrease substantially (10). Therefore, plasma S1P supplied by erythrocytes is essential for the correct distribution of lymphocytes in the blood.
Erythrocytes transport sphingosine, which is supplied by other cells, to the intracellular side of the membrane and produce S1P by phosphorylation (6, 7, 11). In addition to the extracellular source of sphingosine, intracellular alkaline ceramidase also produces sphingosine used for S1P synthesis in human erythrocytes (12). Previously, we reported that erythrocytes export intracellularly synthesized S1P into the extracellular space via an ATP-dependent transporter in a time-dependent manner without any extracellular stimuli (13). SPNS2 has been identified as an S1P transporter in vascular and lymphatic endothelial cells (14–17). A deficiency of SPNS2 in mice decreases the concentration of plasma S1P (14–16, 18) and impairs the egress of lymphocytes from the thymus (14–16, 18, 19). However, the S1P release from erythrocytes in SPNS2-deficient mice is normal (14). Therefore, SPNS2 is not an S1P transporter in erythrocytes, and another unknown transporter must fulfill this role in these cells.
Because the S1P transporter in erythrocytes plays an important role in the normal distribution of lymphocytes, its inhibitors are promising candidates for immunosuppressive drugs (20). To screen for compounds that inhibit the S1P transporter in erythrocytes, a rapid assay for measuring S1P export from erythrocytes is indispensable. Currently, S1P transport activity can be measured using radioactive S1P, followed by TLC or liquid scintillation counting (13) and HPLC to detect ortho-phthalaldehyde-labeled S1P (21) or LC/MS/MS to detect native S1P (14). These methods are unsuitable for high-throughput measurements of S1P transporter activity because they require many steps to detect S1P and are time consuming. Thus, we attempted to develop a simple assay of S1P transport by erythrocytes by using a fluorescent S1P analog of S1P, 7-nitro-2-1,3-benzoxadiazol-4-yl (NBD)-S1P.
MATERIALS AND METHODS
Materials
C17-S1P, NBD-sphingosine (NBD-Sph), NBD-S1P, sphingosine, and S1P were purchased from Avanti Polar Lipids (Alabaster, AL). BSA (fatty acid-free), glyburide, and cyclosporine A were obtained from Sigma-Aldrich (St. Louis, MO). MK571 was purchased from Calbiochem (San Diego, CA). Fumitremorgin C (FTC) was acquired from BioViotica (Dransfeld, Germany). Other reagents were of special grade and were obtained from Wako Chemicals (Osaka, Japan) or Nacalai Tesque (Kyoto, Japan). HPTLC Silica gel 60 plates were purchased from Merck (Darmstadt, Germany).
Preparation of rat erythrocytes
Female Wistar rats (10–15 weeks of age) were anesthetized and approximately 300 μl of blood was collected from the tail vein using an acid citrate-dextrose solution as an anticoagulant. Erythrocytes were prepared by centrifugation at 500 g for 15 min, washed twice with buffer A [20 mM HEPES-NaOH (pH 7.4), 3.3 mM NaH2PO4, 2.9 mM KCl, 1 mM MgCl2, 138 mM NaCl, and 1 g/l glucose] containing 1% BSA, and resuspended in the same buffer. For the preparation of erythrocytes suspended in a buffer A containing 0.1% BSA, erythrocytes were washed twice with buffer A containing 1% BSA and then once with buffer A containing 0.1% BSA. All experimental procedures using rats were conducted in conformity with the Public Health Service Policy on the Humane Care and Use of Laboratory Animals and followed the regulations of the Institutional Animal Care and Use Committee of the Faculty of Pharmaceutical Sciences, Setsunan University (approval number: K15-32, K16-6).
Quantification of NBD-S1P and S1P release from rat erythrocytes
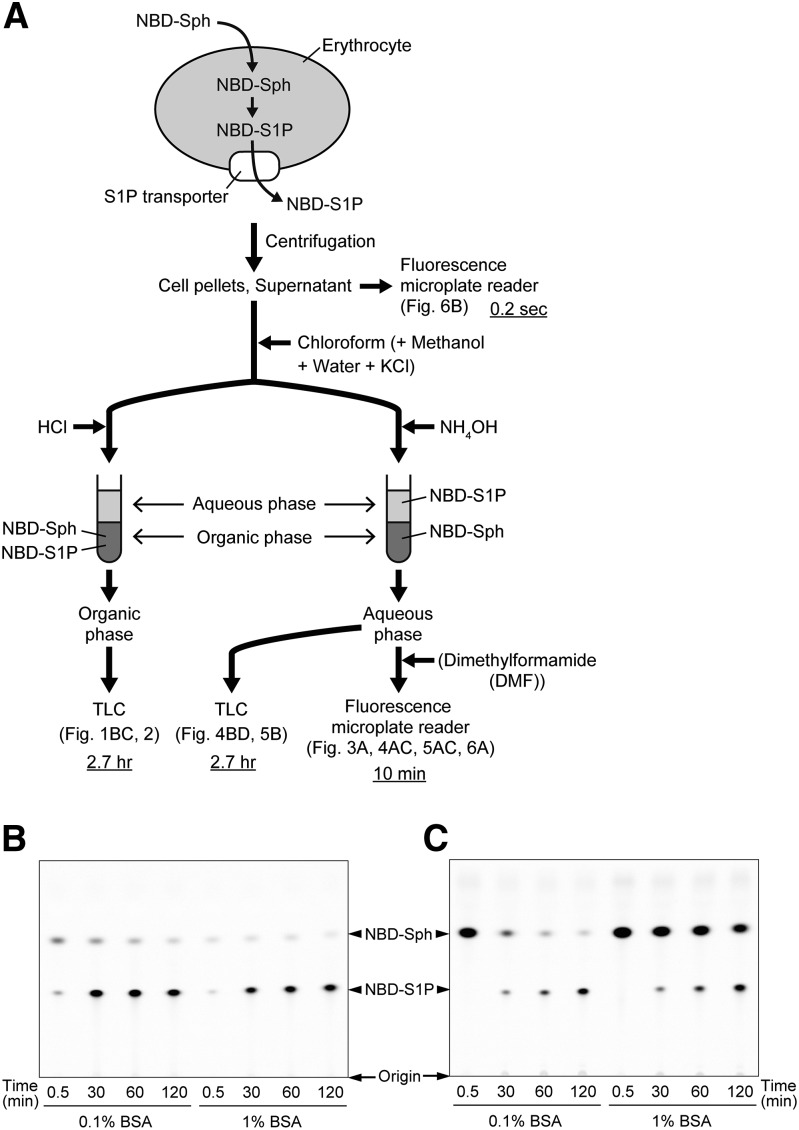
First, 100 μl of erythrocyte suspension (1 × 10⁷ cells) in assay buffer and 100 μl of assay buffer containing 10 μM NBD-Sph were preincubated at 37°C for 10 min. Then, the erythrocytes and the buffer containing NBD-Sph were mixed (final NBD-Sph concentration: 5 μM) and incubated at 37°C. After incubation, the erythrocytes and assay buffer were separated by centrifugation for 5 s at 17,000 g. For the TLC assay, lipids were extracted from the assay buffer and erythrocytes under acidic conditions by using the modified Bligh-Dyer method and were developed as described by Yatomi et al. (22) (Fig. 1A, left). The fluorescent bands of NBD-labeled lipids were quantified using ImageQuant LAS 4000 mini (GE Healthcare Japan, Tokyo, Japan) or ChemiDoc MP (Bio-Rad, Hercules, CA). To quantify the amount of NBD-S1P using a 96-well plate reader or the amount of S1P using HPLC, lipids were extracted from the assay buffer and erythrocytes under alkaline conditions using a modified protocol of Hisano et al. (21) (Fig. 1A right). Lipids were extracted from 200 μl of the assay buffer or lysed erythrocytes. Then, 260 μl of methanol and 400 μl of chloroform/methanol (1:1) were added to the samples and thoroughly mixed. Subsequently, 16 μl of 7 M NH4OH, 400 μl of chloroform, and 300 μl of 1.5 M KCl (or distilled water) were added to the samples and mixed thoroughly. The lipids were separated by centrifugation for 5 min at 17,000 g. The fluorescence intensities of the upper aqueous phases containing NBD-S1P were measured at 530/538 nm with excitation at 490/485 nm in 96-well plates using MTP-810Lab (Corona Electric, Ibaraki, Japan) or FMAX (Molecular Devices, Sunnyvale, CA) (Fig. 1A, right). To quantify NBD-S1P, an aliquot of the upper phase was dried, redissolved in 20 μl of chloroform/methanol (2:1), and analyzed by TLC (Fig. 1A, middle). To quantify S1P by HPLC, the upper aqueous phases were treated with alkaline phosphatases and modified using o-phthalaldehyde, as described by Hisano et al. (21).
Fig. 1.
Schematic illustration of the method for the measurement of NBD-S1P release from erythrocytes. A: The details of the individual steps are described in the Materials and Methods. Underlined times indicate the times required for lipid extraction, separation, and detection of NBD-S1P per sample. B, C: NBD-S1P release from rat erythrocytes was analyzed by TLC. Rat erythrocytes were incubated (5 × 10⁷ cells/ml) in a buffer containing 0.1 or 1% BSA and 5 μM NBD-Sph at 37°C for the indicated times. Then, erythrocytes and the assay buffer were separated by centrifugation. The lipids extracted from the erythrocytes [(B) intracellular] and the assay buffer [(C) extracellular] were analyzed by TLC. The positions where samples were spotted on the TLC plates are denoted as the origins.
RESULTS
NBD-S1P is an S1P transporter substrate in rat erythrocytes
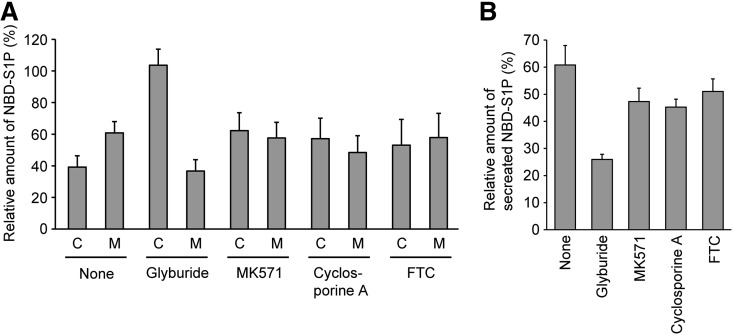
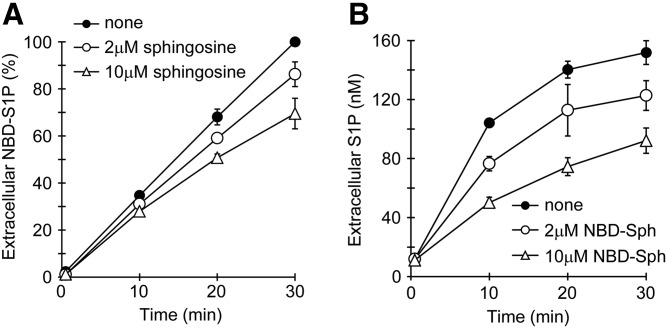
We previously demonstrated that the substrate recognition of erythrocyte S1P transporters is restricted because their activity is not inhibited by DH-S1P or ceramide-1-phosphate (13). Thus, we examined whether NBD-S1P is exported by the S1P transporter of erythrocytes. When NBD-Sph was added to erythrocytes, it was slowly incorporated into the erythrocytes and readily phosphorylated to NBD-S1P (Fig. 1B), as reported previously for Chinese hamster ovary (CHO) cells (23). Synthesized NBD-S1P was immediately exported to the extracellular buffer at a linear rate for at least 2 h (Fig. 1C, supplemental Fig. S1). The kinetic profile of NBD-S1P release is similar to that of S1P release in erythrocytes (13). We previously demonstrated that the erythrocyte S1P transporter is sensitive to an ABC transporter inhibitor, glyburide (13). Similarly, NBD-S1P release from erythrocytes was inhibited by glyburide, but not by MK571, cyclosporine A, or FTC; these compounds are known inhibitors of ABCA1, ABCC, ABCB1, and ABCG2, respectively (Fig. 2). Glyburide clearly inhibited the transport of NBD-S1P, but not the phosphorylation of NBD-Sph, because NBD-S1P accumulated intracellularly when glyburide was added to the assay buffer (Fig. 2A). Furthermore, we investigated the competitive inhibition of NBD-S1P and S1P transport in erythrocytes by S1P and NBD-S1P, respectively (Fig. 3; supplemental Figs. S2, S3). When the same concentrations of NBD-Sph and sphingosine were added to erythrocytes simultaneously, the phosphorylation of NBD-Sph decreased (supplemental Fig. S4). Thus, erythrocytes were preincubated with NBD-Sph for 1 h and then incubated in the presence or absence of sphingosine (Fig. 3A, supplemental Fig. S2). When sphingosine was added to the erythrocytes, it was readily incorporated into the cells and converted to S1P (supplemental Fig. S2B). In the presence of sphingosine, NBD-S1P transport decreased in accordance with the amount of intracellular S1P (Fig. 3A, supplemental Fig. S2B). We also investigated the effect of intracellular NBD-S1P on the S1P transport in erythrocytes (Fig. 3B, supplemental Fig. S3). When 10- or 50-fold NBD-Sph was added to erythrocytes with sphingosine, the amount of intracellular NBD-S1P increased (supplemental Fig. S3A), and S1P transport was suppressed, in accordance with the amount of intracellular NBD-S1P (Fig. 3B, supplemental Fig. S3A). These results indicate that S1P and NBD-S1P share the same transport system in erythrocytes.
Fig. 2.
Effect of ABC transporter inhibitors on NBD-S1P release from rat erythrocytes. Erythrocytes were suspended in 190 μl of buffer A containing 1% BSA and each ABC transporter inhibitor and incubated at 37°C for 10 min. Then, 10 μl of buffer A containing 1% BSA and 100 μM NBD-Sph was added to the erythrocyte suspension. The final concentrations of NBD-Sph, glyburide, MK571, cyclosporine A, and FTC were 5, 500, 50, 10, and 20 μM, respectively. After incubation at 37°C for 1 h, the lipids were extracted from erythrocytes (C) and the assay buffer (M) and then analyzed by TLC. The relative amount of NBD-S1P in the spots was quantified by setting the total amount of NBD-S1P in the absence of inhibitor (none) to 100% (A). The relative amount of secreted NBD-S1P was calculated as follows: (amount in the medium)/(total amount in the medium + in the erythrocytes). The total amount of NBD-S1P in the presence or absence of each inhibitor was set to 100% (B). The experiments were repeated three times, and the error bars indicate the SD.
Fig. 3.
Competitive inhibition of NBD-S1P (A) and S1P (B) release from rat erythrocytes. A: Prepared rat erythrocytes were preincubated with 5 μM NBD-Sph at 37°C for 1 h. Then, the erythrocytes were precipitated by brief centrifugation and washed once with buffer A, which contained 1% BSA. After centrifugation of the suspension, the erythrocytes were resuspended in buffer A containing 1% BSA and incubated in the presence of 2 μM sphingosine (open circles), 10 μM sphingosine (open triangles), or no sphingosine (closed circles). After incubation at 37°C for the indicated period, the lipids in the assay buffer were extracted under alkaline conditions, as described in the Materials and Methods, except that 260 μl of methanol and 300 μl of 1.5 M KCl were replaced with 130 μl of methanol and 150 μl of distilled water, respectively. For NBD-S1P quantification, 250 μl of the upper phase was mixed with 50 μl of DMF, and the fluorescence intensity of the resulting mixture in a 96-well plate was measured with a fluorescence microplate reader. The amounts of extracellular NBD-S1P are expressed as the percent of NBD-S1P at 30 min in the absence of sphingosine. B: Erythrocytes were incubated with 0.2 μM sphingosine in the presence of 2 μM NBD-Sph (open circles), 10 μM NBD-Sph (open triangles), or no NBD-Sph (closed circles). After incubation at 37°C for the indicated period, the lipids in the assay buffer were extracted under alkaline conditions, similarly to (A). The extracellular S1P was measured by HPLC. The experiments were repeated three times, and the error bars indicate the SD.
Optimization of a fluorescence-based S1P transport assay
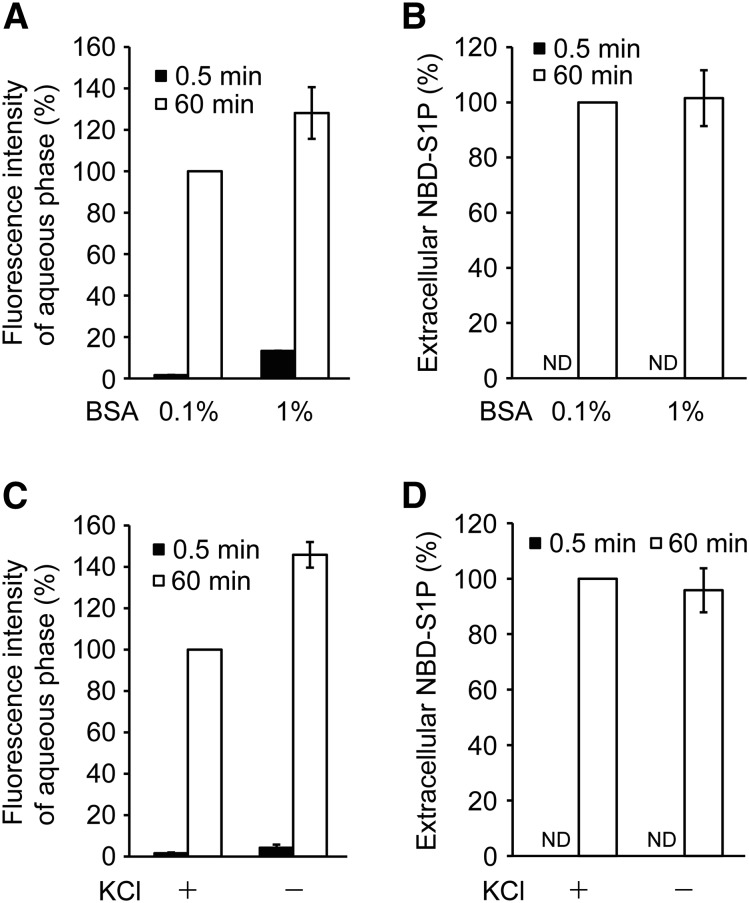
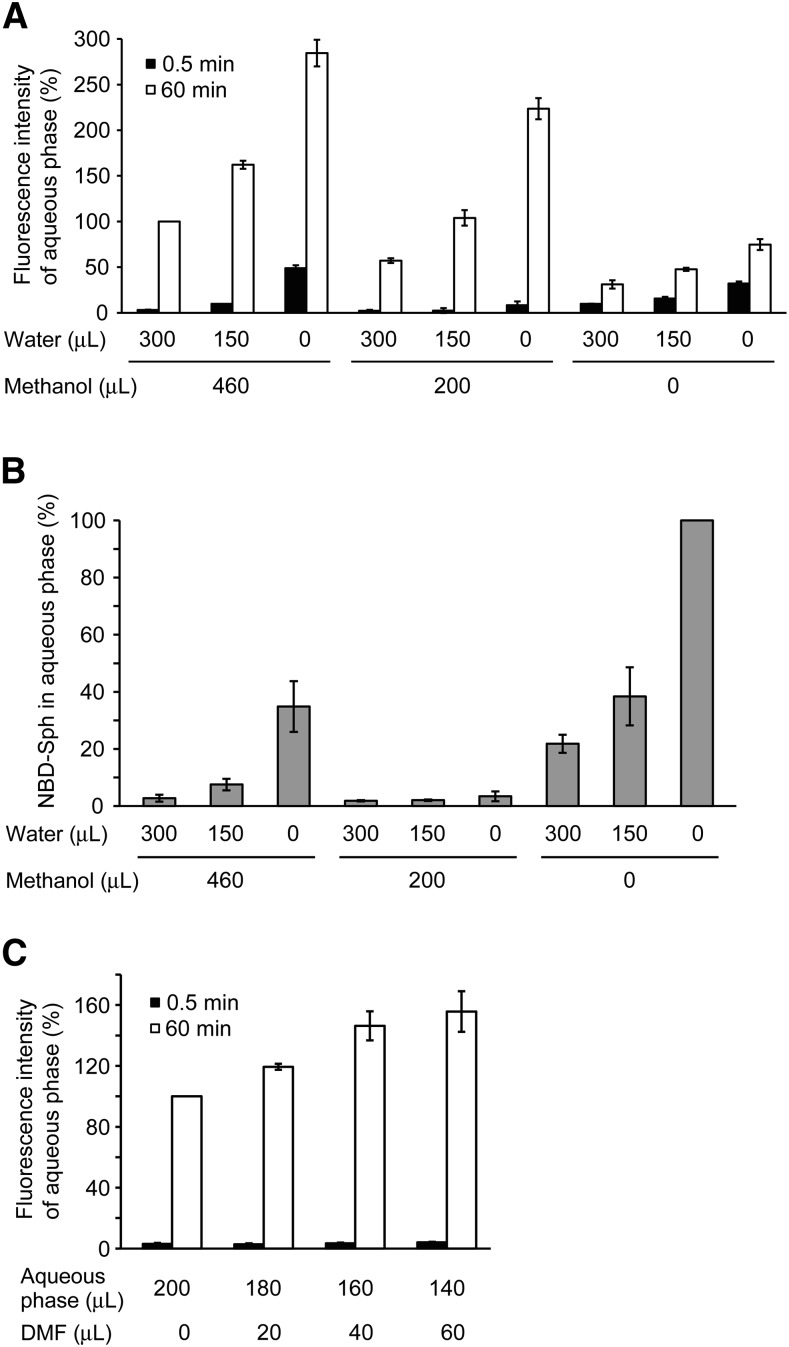
To evaluate the reliability of NBD-S1P as a fluorescence-based indicator of S1P transport activity in erythrocytes, the fluorescence intensity and amount of exported NBD-S1P were compared under different transport assay buffer or lipid extraction conditions (Figs. 4, 5). To establish the most sensitive assay conditions for detecting the amount of exported NBD-S1P using a microplate fluorometer, NBD-Sph was separated from the transport assay buffer by chloroform/methanol extraction, and an aqueous phase containing NBD-S1P was used as described in the Materials and Methods. For the S1P transport assay, we typically utilized a transport assay buffer containing 1% BSA that is used for the S1P carrier protein and stabilizes the erythrocyte membrane (13). When the assay buffer contained no or 0.01% BSA, the erythrocytes were slightly lysed (data not shown). Thus, we compared the amounts of exported NBD-S1P in assay buffers containing 0.1 and 1% BSA after 1 h of incubation with NBD-Sph (Fig. 4A, B). The fluorescence intensity of the aqueous phase containing NBD-S1P that was extracted from the 1% BSA-containing buffer was higher than that obtained from 0.1% BSA-containing buffer at each time point (Fig. 4A). However, the amounts of NBD-S1P did not differ between the assay buffers (Fig. 4B). Although 1% BSA enhanced the fluorescence intensity of NBD-S1P, it also increased the background fluorescence of the microplate assay. Thus, 0.1% BSA is suitable for quantifying NBD-S1P transport in a microplate assay. KCl is typically used for lipid extraction, but chloride ions are known to attenuate fluorescence intensity. Therefore, we investigated the effect of KCl on the lipid extraction (Fig. 4C, D). When KCl was not added during the lipid extraction procedure (as described in the Materials and Methods), the extracellular fluorescence intensity increased at 60 min, but not at 0.5 min (Fig. 4C); whereas, the amount of extracellular NBD-S1P decreased slightly (Fig. 4D). Thus, KCl could be omitted from the lipid extraction method by replacing the KCl solution with the same volume of distilled water. We also reduced the volumes of methanol and distilled water used in the lipid extraction to increase the NBD-S1P concentration of the resulting upper phase (Fig. 5A, B). Adding 200 μl of methanol, but no water, produced the highest extracellular fluorescence after a 60 min incubation with less contamination of NBD-Sph in the aqueous phase (the measurement obtained at 0.5 min was used as the background, Fig. 5A, B). The high background fluorescence observed in several samples after incubation for 0.5 min is attributable to NBD-Sph contamination in the aqueous phase, as confirmed by TLC analysis (Fig. 5B). Finally, we investigated the effect of dimethylformamide (DMF), which was reported to increase the fluorescence intensity of 15-NBD-S1P (24) on the fluorescence intensity of exported NBD-S1P in the assay buffer (Fig. 5C). The fluorescence intensity of NBD-S1P increased as the ratio of DMF to aqueous phase increased and peaked at a ratio of 160:40 (aqueous phase:DMF) (Fig. 5C). When the aqueous phase was prepared from assay buffer containing 1% BSA, the addition of DMF created white precipitate more frequently than when assay buffer containing 0.1% BSA was used.
Fig. 4.
Effect of BSA and KCl on the fluorescence intensity of the aqueous phase containing NBD-S1P. Erythrocytes were incubated in buffer A containing 0.1% (A–D) or 1% BSA (A, B) with 5 μM NBD-Sph at 37°C. After incubation for 60 min (60 min) or without incubation (0.5 min), the cell suspensions were centrifuged briefly. The lipids in the supernatant (extracellular buffer) were extracted under alkaline conditions according to the procedures described in the Materials and Methods (A, B) and with/without KCl (C, D). The fluorescence intensity of the aqueous phase was measured using a fluorescence microplate reader in a 96-well plate (A, C). For NBD-S1P quantitation, 50 μl of the aqueous phase was dried and analyzed by TLC (B, D). The fluorescence intensities of the aqueous phase and the extracellular NBD-S1P prepared from the samples containing 0.1% BSA (60 min) (A, B) or extracted by the addition of 1.5 M KCl (60 min) (C, D) were set to 100%. ND, not detected. The experiments were repeated three times, and the error bars indicate the SD.
Fig. 5.
Effect of different volumes of distilled water and methanol on the lipid extraction and DMF on the fluorescence intensity of the aqueous phase containing NBD-S1P. Erythrocytes were incubated in buffer A containing 0.1% BSA with 5 μM NBD-Sph at 37°C. After incubation for 60 min (60 min) or without incubation (0.5 min), the cell suspensions were centrifuged briefly. The lipids of the supernatant (extracellular buffer) were extracted under alkaline conditions according to the procedures described in the Materials and Methods, except for the volume of methanol and distilled water (A, B) or without the addition of methanol and 1.5 M KCl (C). The fluorescence intensity of the aqueous phase was measured using a fluorescence microplate reader in a 96-well plate. To quantify NBD-Sph, 50 μl of aqueous phase (0.5 min) was dried and analyzed by TLC (B). The values were expressed as the percent of fluorescence intensity of the aqueous phase prepared with the addition of 460 μl of methanol and 300 μl of distilled water (60 min) (A), the fluorescence intensity of NBD-Sph without methanol and distilled water (B), or the fluorescence intensity of aqueous phase prepared without DMF (C). The experiments were repeated three times, and the error bars indicate the SD.
Based on these results, the optimized conditions for the NBD-S1P transport assay were defined as follows: After incubating erythrocytes with NBD-Sph in 200 μl of buffer A containing 0.1% BSA, lipid extraction should be performed by stepwise addition of 400 μl of chloroform/methanol (1:1), 16 μl of 7 M NH4OH, and 400 μl of chloroform; 160 μl of aqueous phase with 40 μl of DMF should be used for fluorescence detection.
Quantification of NBD-S1P release using a microplate reader
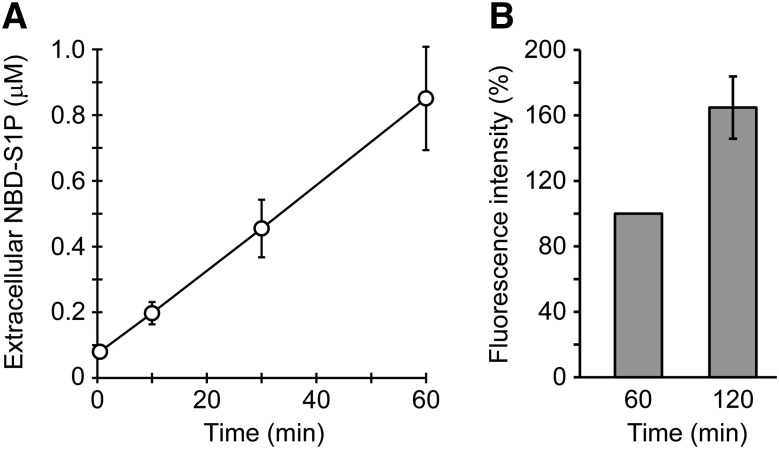
To quantify the amounts of extracellular and intracellular NBD-S1P, standard curves were generated (supplemental Fig. S5). Known concentrations of NBD-S1P were added to the assay buffer or erythrocyte lysate and extracted, and then, the fluorescence of NBD-S1P was measured as described above. Because erythrocyte lysates affect the intensity of NBD-S1P fluorescence, separate standard curves for extracellular and intracellular NBD-S1P were made (supplemental Fig. S5). Because half of the aqueous phase was sufficient to determine NBD-S1P release, the volumes of the samples and reagents optimized in the previous section were reduced by half. Intracellular NBD-S1P increased and reached a maximum (600 pmol/107 cells) at 30 min (supplemental Fig. S6). In contrast, the amount of exported NBD-S1P increased linearly until 60 min (Fig. 6A). These results are consistent with the TLC findings (supplemental Fig. S1).
Fig. 6.
Detection of NBD-S1P release from rat erythrocytes by using a microplate reader. A: Rat erythrocytes (5 × 10⁶ cells) were incubated in 100 μl of buffer A containing 0.1% BSA and 5 μM NBD-Sph for the indicated times at 37°C. The lipids in the assay buffer (extracellular) were extracted under alkaline conditions, similarly to Fig. 5C, except that all the reagents were added at half of the original volumes. DMF (40 μl) was added to 160 μl of the aqueous phase, and the fluorescence intensities of the mixtures in a 96-well plate were measured using a fluorescence microplate reader. NBD-S1P standards were prepared to quantify extracellular NBD-S1P (supplemental Fig. S5). Duplicate experiments were performed four times, and the error bars indicate the SD. B: Erythrocytes (1 × 10⁷ cells) were incubated in 200 μl of buffer A containing 0.1% BSA and 5 μM NBD-Sph at 37°C for the indicated times. Then, the assay buffer was separated from the erythrocytes via a brief centrifugation step. The fluorescence intensity of the assay buffer was directly measured using a 96-well plate in a fluorescence microplate reader without lipid extraction. The fluorescence intensity at 60 min was taken as 100%. The experiments were repeated four times, and the error bars indicate the SD.
In our conventional method, 1% BSA is used to promote the efficient export of S1P. However, 1% BSA trapped more NBD-Sph in the extracellular medium and made distinguishing the fluorescence of NBD-S1P and NBD-Sph in the assay buffer difficult (Fig. 1C). As shown in Fig. 1C, the amount of extracellular NBD-Sph was much lower in 0.1% BSA than in 1% BSA. Therefore, we investigated whether the fluorescence increase of NBD-S1P in extracellular assay buffer containing 0.1% BSA could be detected without lipid extraction (Fig. 6B). The fluorescence increase caused by the extracellular assay buffer was observed clearly after 120 min of incubation. Thus, NBD-S1P release can be detected in the assay buffer without the influence of NBD-Sph by directly measuring the fluorescence of the assay buffer without lipid extraction.
DISCUSSION
In erythrocytes, sphingosine is incorporated into cells and converted to S1P because of sphingosine kinase activity and the lack of ceramide synthase activity (6). Similarly, NBD-Sph is also only converted to its phosphorylated form, NBD-S1P, in erythrocytes (Fig. 1B, C). In CHO cells, NBD-Sph is incorporated into the cells and converted into several NBD-labeled sphingolipids, including NBD-S1P, NBD-ceramide, and NBD-sphingomyelin, similarly to sphingosine metabolism (23). The simplicity of sphingosine metabolism in erythrocytes facilitates interpreting changes in the fluorescence intensity derived from NBD-S1P; thus, changes in the amount of NBD-S1P were determined in terms of NBD-S1P transport and/or sphingosine kinase activity.
Previously, we showed that sphingosine is readily incorporated into erythrocytes and phosphorylated to S1P (13). The sphingosine kinase activity in erythrocytes was extremely limited (3 pmol/min/mg) (7), but the abundance of erythrocytes in blood enables a high concentration of S1P in plasma. When NBD-Sph was added to erythrocytes, the amount of intracellular NBD-Sph was much smaller than that of extracellular NBD-Sph (Fig. 1B, C). In contrast to the results shown in Fig. 1B, C and supplemental Fig. S1, which were obtained using a higher concentration of NBD-Sph (5 μM) than of sphingosine (0.01 μM) (13), a lower rate of NBD-Sph incorporation was observed under the same conditions (0.01 μM NBD-Sph, supplemental Fig. S7). In addition, NBD-Sph was efficiently incorporated into erythrocytes when the BSA concentration was 0.1% than when it was 1% (Fig. 1B). These results suggest that the NBD moiety of NBD-Sph decreases the incorporation velocity of NBD-Sph across plasma membranes and/or causes NBD-Sph to prefer the extracellular medium by increasing its binding affinity for BSA.
In erythrocytes, S1P is produced only by sphingosine kinase 1 (25). Although NBD-Sph was readily converted to NBD-S1P following the incorporation of NBD-Sph into erythrocytes (Fig. 1B), the rate of NBD-Sph phosphorylation is estimated to be 20% of that of sphingosine (24, 26, 27). Consistent with this estimate, the addition of sphingosine to the extracellular buffer with NBD-Sph decreased the production of intracellular NBD-S1P without affecting the amount of intracellular NBD-Sph (supplemental Fig. S4). Therefore, sphingosine is a better substrate for sphingosine kinase 1 than NBD-Sph. Although more intracellular NBD-S1P was synthesized in the assay buffer containing 0.1% BSA than in that containing 1% BSA, similar amounts of NBD-S1P were released under both assay conditions (Fig. 1B, C). This finding is different from that observed with SPNS2, which exports S1P as a passive transporter depending on the intracellular S1P concentration (21). The saturation of NBD-S1P release suggests the involvement of an active transport system in S1P release from erythrocytes.
To date, SPNS2 is the only S1P transporter that has been identified (18). A defect in SPNS2 in mice caused a large decrease in circulating T cells and an accumulation of cells in the thymus, although the S1P concentration of the blood plasma was maintained at 60% of that in wild-type mice (14). The plasma S1P concentration in SPNS2-deficient mice is probably sufficient to generate the S1P concentration gradient between blood and lymphoid organs that has been suggested to be necessary for lymphocyte egress from the organs to blood. SPNS2-deficiency in mice impaired the S1P release from vascular endothelial cells, but not from erythrocytes. SPNS2 expression was detected in vascular endothelial cells of the thymus (14). Thus, we hypothesized that SPNS2 regulates lymphocyte trafficking by supplying local extracellular S1P surrounding the site of lymphocyte exit from the thymus (20). Erythrocytes are the major supplier of the plasma S1P necessary for normal lymphocyte trafficking. Because S1P release from erythrocytes in SPNS2-deficient mice is normal, another S1P transporter is expressed in erythrocytes and regulates the circulation of lymphocytes. These results suggested that different S1P transporters expressed in different cell types may make different individual contributions to lymphocyte trafficking. These features of S1P transporters will likely enable the discovery of immunosuppressive drugs targeted to these proteins, which will have individual pharmacological actions and limited side effects.
Recently, a high-throughput assay method for measuring sphingosine kinase activity by detecting NBD-S1P in a mixture containing NBD-Sph was reported (27). In this method, the addition of 0.05% Triton X-100 causes a red-shift in the fluorescence of NBD-S1P and enables the measurement of NBD-S1P in a mixture containing NBD-Sph. However, quantifying NBD-S1P at concentrations less than 1 μM is difficult using this method because approximately 1 μM NBD-S1P results in no fluorescence (Ex = 550 nm, Em = 584 nm). Actually, we could not detect the fluorescence (Ex = 550 nm, Em = 584 nm) of 1.25 μM NBD-S1P (Ex = 550 nm, Em = 584 nm) in buffer A with or without 0.1% BSA in the presence of 0.05% Triton X-100. Thus, using our experimental conditions, it is difficult to distinguish the fluorescence of NBD-S1P and NBD-Sph. However, as shown in Fig. 6B, we successfully detected the fluorescence increase in the extracellular assay buffer attributed to NBD-S1P release without lipid extraction by reducing the BSA concentration. Although determining the precise amount of released NBD-S1P is difficult because of the small amount of residual NBD-Sph in the assay buffer, this method is useful for assaying many samples and, thus, likely has applications in high-throughput screening.
The characteristics of the methods used for this study and the previously reported methods used for measuring S1P release from cells are summarized in supplemental Table S1. Among the three methods used for detecting NBD-S1P transport, the TLC method provides better sensitivity, but requires more time for lipid extraction, separation, and detection. The two microplate reader methods require the shortest time for lipid extraction and detection, and the lowest costs for operation and equipment, whereas their sensitivities are lower than those of the TLC method. The exclusion of lipid separation from the microplate reader methods substantially shortens the required time. This method allows for the shortest running time for detecting S1P transport activity. The time required for lipid extraction, separation, and detection in the LC/MS/MS method is comparable to that of the plate reader methods and is shorter than the other methods, and can be completed within 30 min. S1P measurement using LC/MS/MS is very sensitive, but it requires approximately 14 min per sample for separation and detection, and a large initial investment for equipment is required, as well as a specialist to operate of the instrument. Therefore, the LC/MS/MS method is not suitable for the high throughput screening of the drugs that target S1P transport activity in erythrocytes. The microplate reader methods developed in this study require only a very short time for detection and have a lower cost for operation and equipment than all other methods. Therefore, the microplate reader methods are the best choice for measuring S1P transport in erythrocytes regarding throughput, multiplexing, cost, and ease of use.
When the S1P concentration of blood plasma was drastically decreased, lymphocyte exit from lymphoid organs was suppressed (10). Because the erythrocyte S1P transporter controls the S1P concentration in the plasma, inhibition of the transporter likely decreases S1P levels in the plasma and suppresses lymphocyte exit from lymphoid organs. Therefore, S1P transporters are good targets for new immunosuppressive agents. In this study, we report a method for measuring erythrocyte S1P transport activity that is quicker than conventional methods. This method will facilitate screening for new immunosuppressive drugs that specifically target the erythrocyte S1P transporter. This is the first report of a fluorescence assay for measuring S1P transporter activity.
Supplementary Material
Footnotes
Abbreviations:
- Em
- emission wavelength
- Ex
- excitation wavelength
- FTC
- fumitremorgin C
- DMF
- dimethylformamide
- NBD
- 7-nitro-2-1,3-benzoxadiazol-4-yl
- NBD-Sph
- omega(7-nitro-2-1,3-benzoxadiazol-4-yl)(2S,3R,4E)-2-aminooctadec-4-ene-1,3-diol
- S1P
- sphingosine-1-phosphate
This work was supported by Japan Society for the Promotion of Science KAKENHI (Grant 25870695 to N.K.) and the Cooperative Research Program of the “Network Joint Research Center for Materials and Devices” and AMED-CREST (to N.K. and T.N.).
The online version of this article (available at http://www.jlr.org) contains a supplement.
REFERENCES
- 1.Chi H. 2011. Sphingosine-1-phosphate and immune regulation: trafficking and beyond. Trends Pharmacol. Sci. 32: 16–24. [DOI] [PMC free article] [PubMed] [Google Scholar]
- 2.Cyster J. G., and Schwab S. R.. 2012. Sphingosine-1-phosphate and lymphocyte egress from lymphoid organs. Annu. Rev. Immunol. 30: 69–94. [DOI] [PubMed] [Google Scholar]
- 3.Spiegel S., and Milstien S.. 2011. The outs and the ins of sphingosine-1-phosphate in immunity. Nat. Rev. Immunol. 11: 403–415. [DOI] [PMC free article] [PubMed] [Google Scholar]
- 4.Proia R. L., and Hla T.. 2015. Emerging biology of sphingosine-1-phosphate: its role in pathogenesis and therapy. J. Clin. Invest. 125: 1379–1387. [DOI] [PMC free article] [PubMed] [Google Scholar]
- 5.Rivera J., Proia R. L., and Olivera A.. 2008. The alliance of sphingosine-1-phosphate and its receptors in immunity. Nat. Rev. Immunol. 8: 753–763. [DOI] [PMC free article] [PubMed] [Google Scholar]
- 6.Yang L., Yatomi Y., Miura Y., Satoh K., and Ozaki Y.. 1999. Metabolism and functional effects of sphingolipids in blood cells. Br. J. Haematol. 107: 282–293. [DOI] [PubMed] [Google Scholar]
- 7.Ito K., Anada Y., Tani M., Ikeda M., Sano T., Kihara A., and Igarashi Y.. 2007. Lack of sphingosine 1-phosphate-degrading enzymes in erythrocytes. Biochem. Biophys. Res. Commun. 357: 212–217. [DOI] [PubMed] [Google Scholar]
- 8.Venkataraman K., Lee Y. M., Michaud J., Thangada S., Ai Y., Bonkovsky H. L., Parikh N. S., Habrukowich C., and Hla T.. 2008. Vascular endothelium as a contributor of plasma sphingosine 1-phosphate. Circ. Res. 102: 669–676. [DOI] [PMC free article] [PubMed] [Google Scholar]
- 9.Olivera A., Allende M. L., and Proia R. L.. 2013. Shaping the landscape: metabolic regulation of S1P gradients. Biochim. Biophys. Acta. 1831: 193–202. [DOI] [PMC free article] [PubMed] [Google Scholar]
- 10.Pappu R., Schwab S. R., Cornelissen I., Pereira J. P., Regard J. B., Xu Y., Camerer E., Zheng Y. W., Huang Y., Cyster J. G., et al. . 2007. Promotion of lymphocyte egress into blood and lymph by distinct sources of sphingosine-1-phosphate. Science. 316: 295–298. [DOI] [PubMed] [Google Scholar]
- 11.Hänel P., Andréani P., and Gräler M. H.. 2007. Erythrocytes store and release sphingosine 1-phosphate in blood. FASEB J. 21: 1202–1209. [DOI] [PubMed] [Google Scholar]
- 12.Xu R., Sun W., Jin J., Obeid L. M., and Mao C.. 2010. Role of alkaline ceramidases in the generation of sphingosine and its phosphate in erythrocytes. FASEB J. 24: 2507–2515. [DOI] [PMC free article] [PubMed] [Google Scholar]
- 13.Kobayashi N., Kobayashi N., Yamaguchi A., and Nishi T.. 2009. Characterization of the ATP-dependent sphingosine 1-phosphate transporter in rat erythrocytes. J. Biol. Chem. 284: 21192–21200. [DOI] [PMC free article] [PubMed] [Google Scholar]
- 14.Hisano Y., Kobayashi N., Yamaguchi A., and Nishi T.. 2012. Mouse SPNS2 functions as a sphingosine-1-phosphate transporter in vascular endothelial cells. PLoS One. 7: e38941. [DOI] [PMC free article] [PubMed] [Google Scholar]
- 15.Fukuhara S., Simmons S., Kawamura S., Inoue A., Orba Y., Tokudome T., Sunden Y., Arai Y., Moriwaki K., Ishida J., et al. . 2012. The sphingosine-1-phosphate transporter Spns2 expressed on endothelial cells regulates lymphocyte trafficking in mice. J. Clin. Invest. 122: 1416–1426. [DOI] [PMC free article] [PubMed] [Google Scholar]
- 16.Nagahashi M., Kim E. Y., Yamada A., Ramachandran S., Allegood J. C., Hait N. C., Maceyka M., Milstien S., Takabe K., and Spiegel S.. 2013. Spns2, a transporter of phosphorylated sphingoid bases, regulates their blood and lymph levels, and the lymphatic network. FASEB J. 27: 1001–1011. [DOI] [PMC free article] [PubMed] [Google Scholar]
- 17.Mendoza A., Breart B., Ramos-Perez W. D., Pitt L. A., Gobert M., Sunkara M., Lafaille J. J., Morris A. J., and Schwab S. R.. 2012. The transporter Spns2 is required for secretion of lymph but not plasma sphingosine-1-phosphate. Cell Reports. 2: 1104–1110. [DOI] [PMC free article] [PubMed] [Google Scholar]
- 18.Hisano Y., Nishi T., and Kawahara A.. 2012. The functional roles of S1P in immunity. J. Biochem. 152: 305–311. [DOI] [PubMed] [Google Scholar]
- 19.Nijnik A., Clare S., Hale C., Chen J., Raisen C., Mottram L., Lucas M., Estabel J., Ryder E., Adissu H., et al. . 2012. The role of sphingosine-1-phosphate transporter Spns2 in immune system function. J. Immunol. 189: 102–111. [DOI] [PMC free article] [PubMed] [Google Scholar]
- 20.Nishi T., Kobayashi N., Hisano Y., Kawahara A., and Yamaguchi A.. 2014. Molecular and physiological functions of sphingosine 1-phosphate transporters. Biochim. Biophys. Acta. 1841: 759–765. [DOI] [PubMed] [Google Scholar]
- 21.Hisano Y., Kobayashi N., Kawahara A., Yamaguchi A., and Nishi T.. 2011. The sphingosine 1-phosphate transporter, SPNS2, functions as a transporter of the phosphorylated form of the immunomodulating agent FTY720. J. Biol. Chem. 286: 1758–1766. [DOI] [PMC free article] [PubMed] [Google Scholar]
- 22.Yatomi Y., Ohmori T., Rile G., Kazama F., Okamoto H., Sano T., Satoh K., Kume S., Tigyi G., Igarashi Y., et al. . 2000. Sphingosine 1-phosphate as a major bioactive lysophospholipid that is released from platelets and interacts with endothelial cells. Blood. 96: 3431–3438. [PubMed] [Google Scholar]
- 23.Hakogi T., Shigenari T., Katsumura S., Sano T., Kohno T., and Igarashi Y.. 2003. Synthesis of fluorescence-labeled sphingosine and sphingosine 1-phosphate; effective tools for sphingosine and sphingosine 1-phosphate behavior. Bioorg. Med. Chem. Lett. 13: 661–664. [DOI] [PubMed] [Google Scholar]
- 24.Billich A., and Ettmayer P.. 2004. Fluorescence-based assay of sphingosine kinases. Anal. Biochem. 326: 114–119. [DOI] [PubMed] [Google Scholar]
- 25.Kihara A., and Igarashi Y.. 2008. Production and release of sphingosine 1-phosphate and the phosphorylated form of the immunomodulator FTY720. Biochim. Biophys. Acta. 1781: 496–502. [DOI] [PubMed] [Google Scholar]
- 26.Ettmayer P., Billich A., Baumruker T., Mechtcheriakova D., Schmid H., and Nussbaumer P.. 2004. Fluorescence-labeled sphingosines as substrates of sphingosine kinases 1 and 2. Bioorg. Med. Chem. Lett. 14: 1555–1558. [DOI] [PubMed] [Google Scholar]
- 27.Lima S., Milstien S., and Spiegel S.. 2014. A real-time high-throughput fluorescence assay for sphingosine kinases. J. Lipid Res. 55: 1525–1530. [DOI] [PMC free article] [PubMed] [Google Scholar]
Associated Data
This section collects any data citations, data availability statements, or supplementary materials included in this article.


