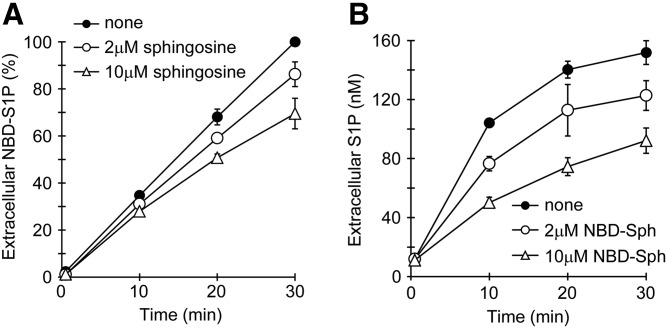
Fig. 3.
Competitive inhibition of NBD-S1P (A) and S1P (B) release from rat erythrocytes. A: Prepared rat erythrocytes were preincubated with 5 μM NBD-Sph at 37°C for 1 h. Then, the erythrocytes were precipitated by brief centrifugation and washed once with buffer A, which contained 1% BSA. After centrifugation of the suspension, the erythrocytes were resuspended in buffer A containing 1% BSA and incubated in the presence of 2 μM sphingosine (open circles), 10 μM sphingosine (open triangles), or no sphingosine (closed circles). After incubation at 37°C for the indicated period, the lipids in the assay buffer were extracted under alkaline conditions, as described in the Materials and Methods, except that 260 μl of methanol and 300 μl of 1.5 M KCl were replaced with 130 μl of methanol and 150 μl of distilled water, respectively. For NBD-S1P quantification, 250 μl of the upper phase was mixed with 50 μl of DMF, and the fluorescence intensity of the resulting mixture in a 96-well plate was measured with a fluorescence microplate reader. The amounts of extracellular NBD-S1P are expressed as the percent of NBD-S1P at 30 min in the absence of sphingosine. B: Erythrocytes were incubated with 0.2 μM sphingosine in the presence of 2 μM NBD-Sph (open circles), 10 μM NBD-Sph (open triangles), or no NBD-Sph (closed circles). After incubation at 37°C for the indicated period, the lipids in the assay buffer were extracted under alkaline conditions, similarly to (A). The extracellular S1P was measured by HPLC. The experiments were repeated three times, and the error bars indicate the SD.

