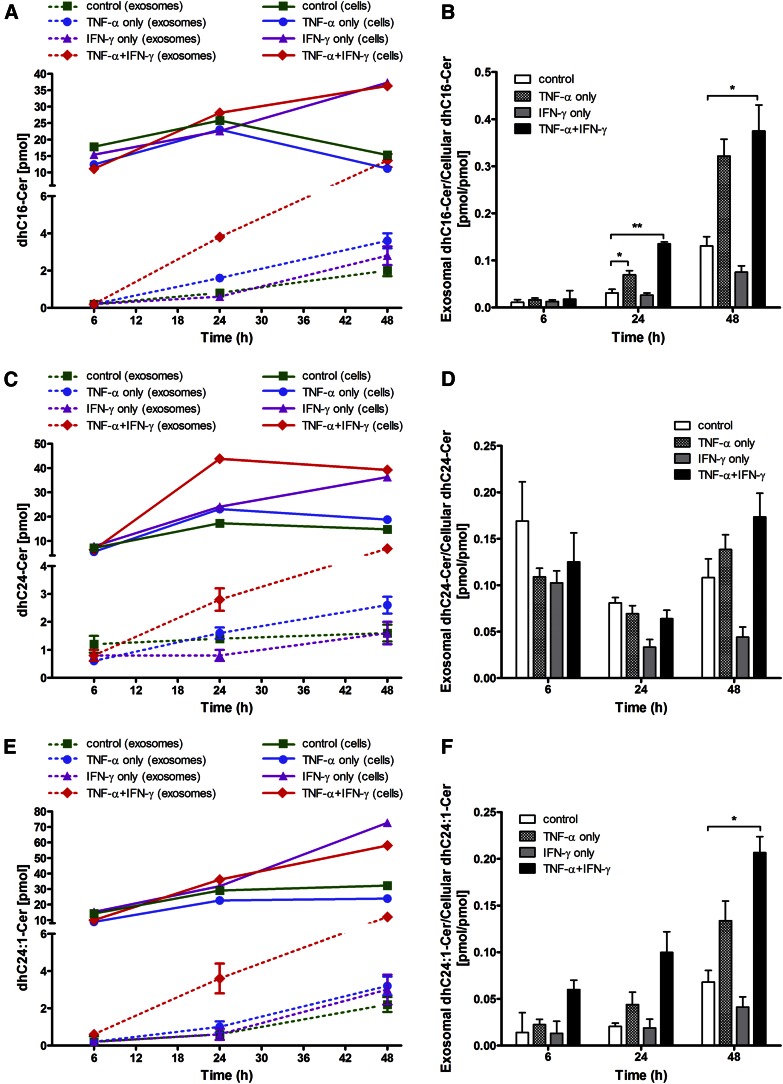
Fig. 3.
Levels of major dhCer species released in exosomes relative to their cellular content as a function of time of Th1 cytokine treatment. HOG cells were either left untreated or treated with TNF-α (100 ng/ml), IFN-γ (100 ng/ml), or both under serum-free conditions. After the specified time of treatment (6, 24, and 48 h), the harvested cells and isolated exosomes were subjected to dhCer analysis by HPLC-MS/MS. A, C, E: Exosomal levels of major dhCer species: dhC16:0-, dhC24:0-, and dhC24:1-Cer (dashed lines) relative to their cellular level (solid lines). B, D, F: The corresponding exosomal-to-cellular ratios of the same dhCer species. *P < 0.05, **P < 0.01; N = 2.

