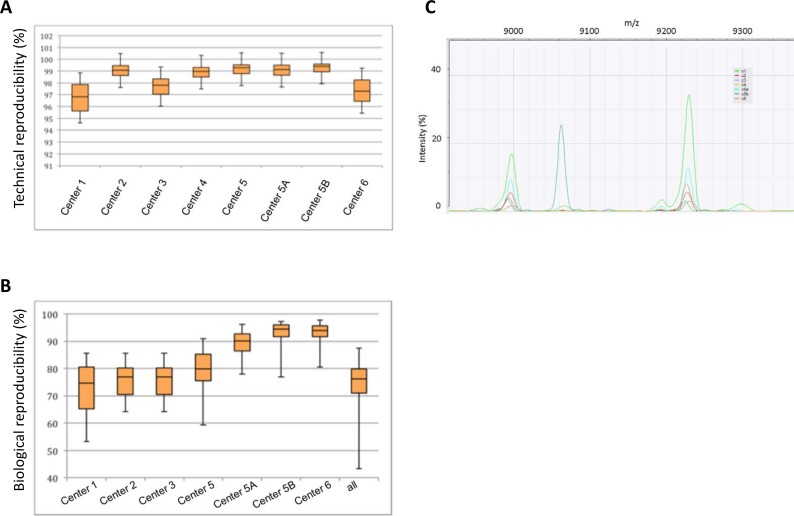
Fig 1. Reproducibility of MALDI-TOF MS based typing data.
Box-plots show the average similarities in percentage. Median and interquartile range is indicated, whiskers indicate the range. Numbers indicate the different centers, (e.g. center 1 etc.); center 5A and 5B indicates that two microbiologists independently performed the experiment at center 5. (A) Technical reproducibility in percent. (B) Biological reproducibility in percent. (C) Peak comparison between centers. Three peaks are shown: peaks at 9000 and 9220 m/z are detected by all centers, however the peak at 9060 is only detected by one center.

