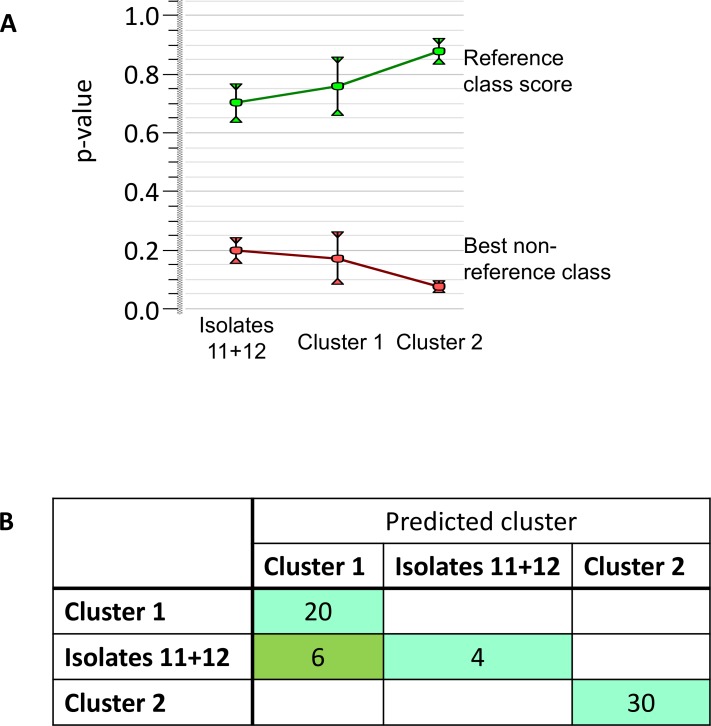
Fig 4. Classifier data analysis.
(A) Separating capacity for reference center: average scores (p-values) and standard deviation with the own group of the spectra (green) and with the best scoring other group (red). For each group the score with the own group is highest with no overlap in the standard deviation of both scores. (B) Separating capacity for all centers: the number of isolates belonging to a certain predicted group by SVM per group they actually belong to. The diagonal contains the number of correct identifications per group, outside the diagonal are the incorrect identifications.

