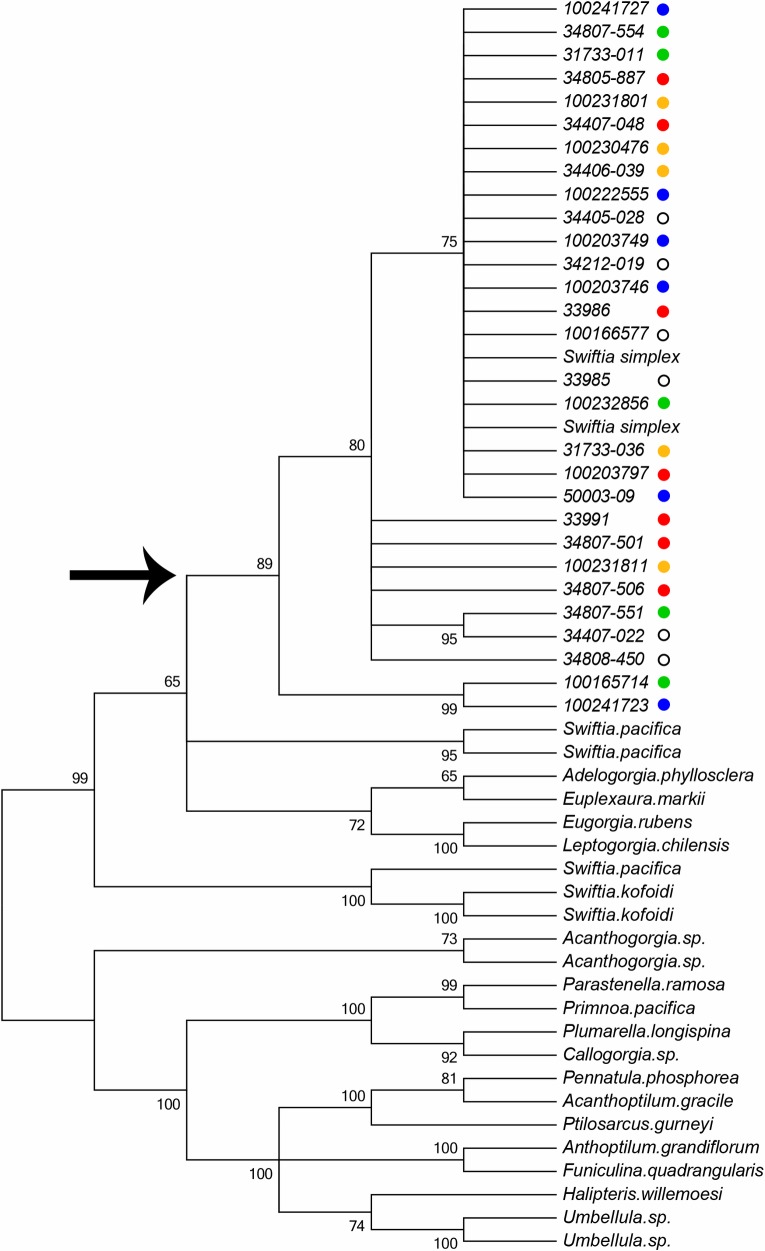
Fig 2. Maximum parsimony phylogeny obtained with the MutS sequence.
The arrow indicates the branch containing all S. simplex individuals. Additional species are from our voucher collection (S1 Table). Colored dots after each individual correspond to putative population groupings indicated in Fig 1 and Table 1. Numbers at branch nodes are bootstrap values from 1,000 replicates. While there are four haplotypes of S. simplex, there is no correspondence with geographic grouping. Branch lengths are not scaled.

