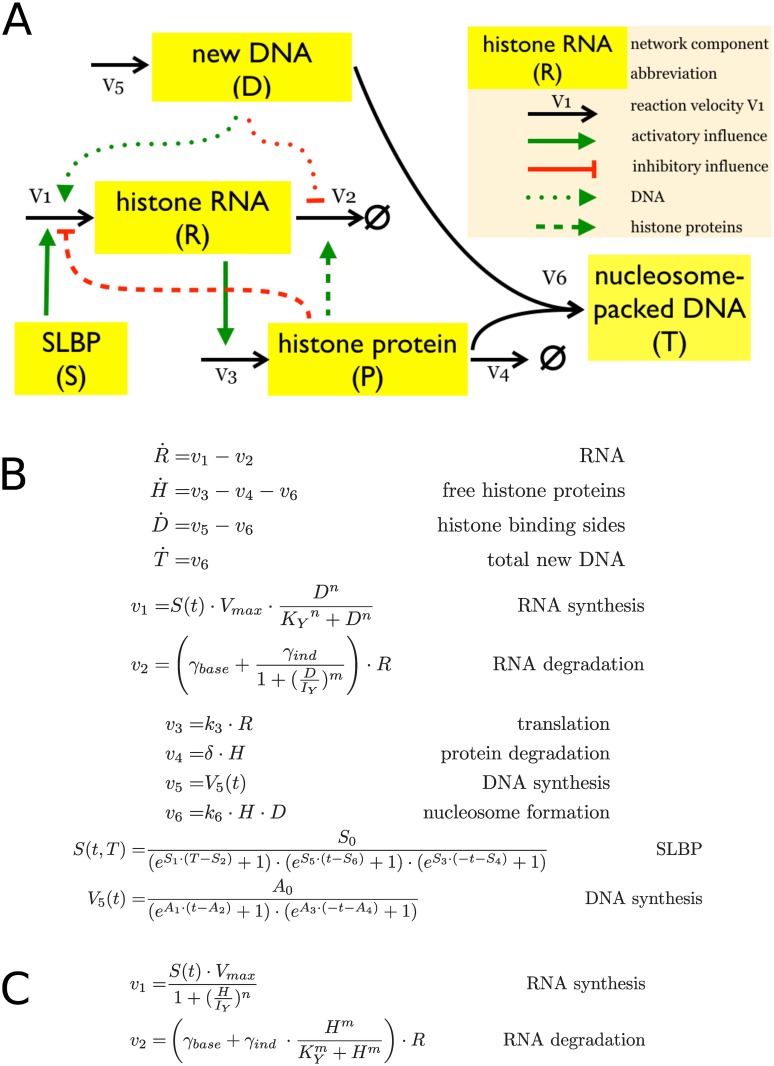
Fig 1. Model structures and equations.
Histone feedback loop model and DNA coupled model. (A) Model structure. Dashed lines illustrate the links between free histone proteins and histone RNA synthesis and degradation (histone feedback loop model). The links between DNA replication and histone RNA are illustrated by dotted lines (DNA coupled model). Solid lines are common to both models. (B) and (C). Full set of equations for the histone feedback loop model (B) and the alternative fluxes v1 and v2 for the DNA coupled model (C). Other equations and fluxes are common to both models.

