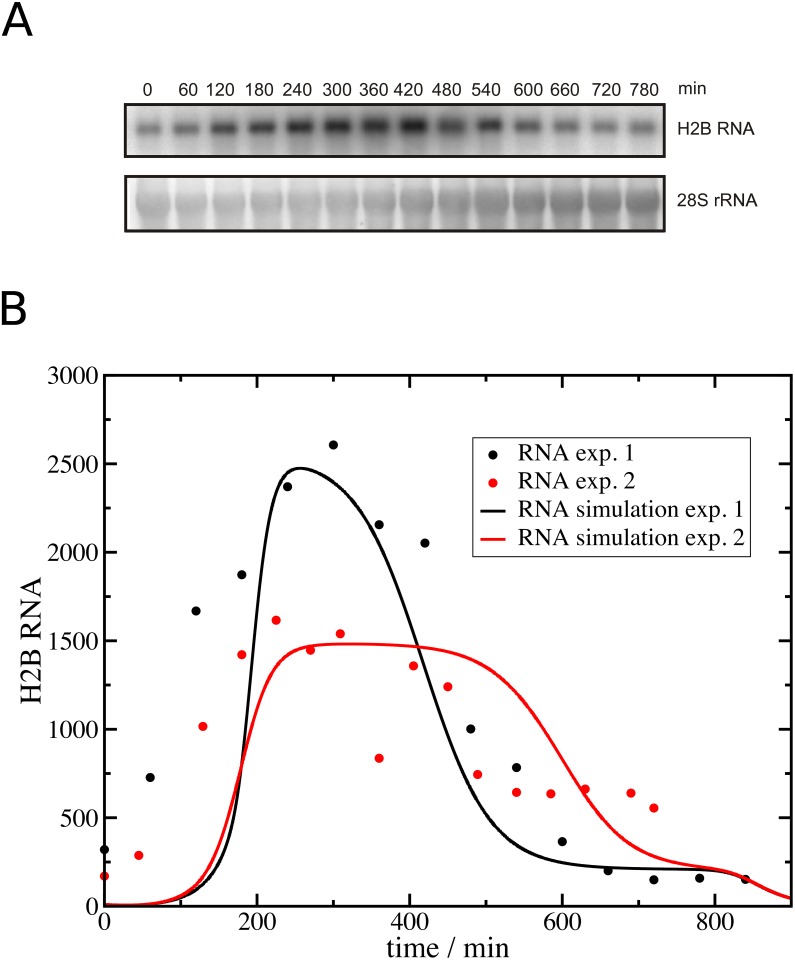
Fig 4. A comparison of histone RNA levels measured experimentally and predicted by the model.
(A) U2OS cells were synchronised and released into S phase as described in Materials and Methods. Total RNA was prepared before release into S phase (0 min time point) and at regular intervals after that, and histone H2B RNA levels were subsequently analysed by Northern blotting. 28S rRNA levels were also measured and H2B RNA levels were standardised using 28S rRNA as a reference. (B) The graph shows the model prediction of histone RNA based on the analysis of DNA replication from two independent experiments (RNA simulation exp1 and 2, see S2 File). Also shown is the quantitation of the RNA analysis by Northern blotting from these two experiments (RNA exp 1 and 2). Note these data were scaled to match the maxima of the model predictions.

