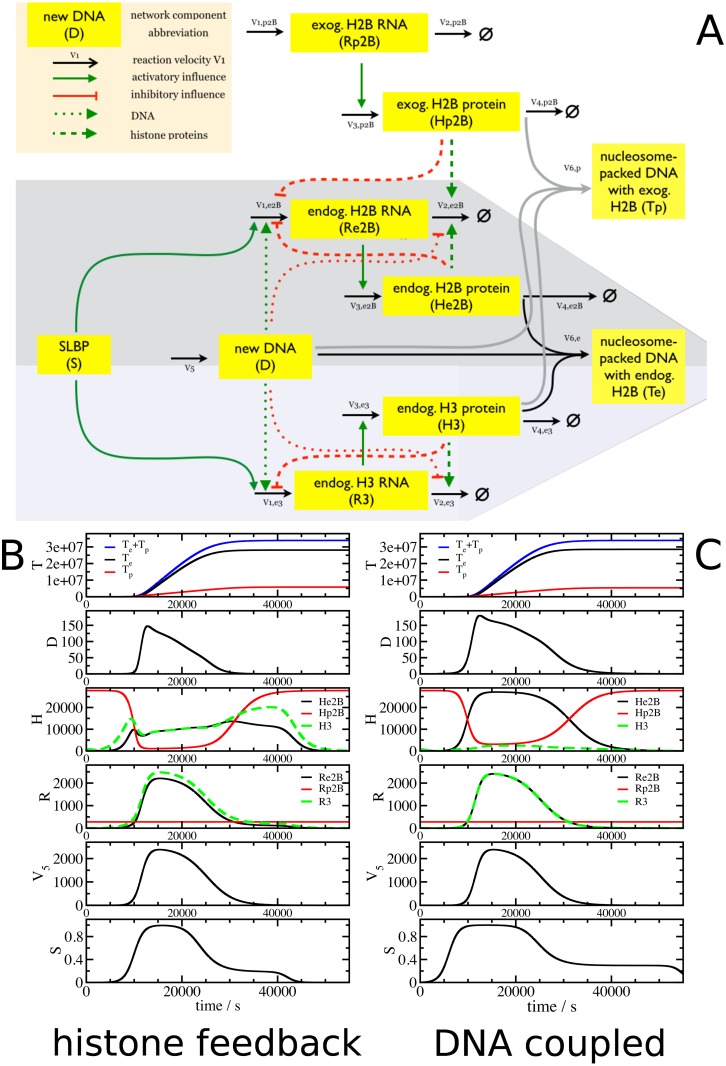
Fig 5. Modelling autoregulation of histone gene expression.
(A) Model structure. Expansion of the basic models to test the effect of additional H2B genes on the expression of endogenous H2B and H3 genes. (B) and (C). Panels describe the time evaluation of histone RNA (R), histone proteins (H), free histone binding sites on DNA (D), nucleosome packed DNA formed from endogenous histone H2B and H3 (Te), formed from exogenous H2B and endogenous H3 (Tp) simulated by the mathematical models as a function of the external influence of SLBP (S) and DNA synthesis (V5). Shown are results for the histone feedback loop (B) and DNA coupled (C) model.

