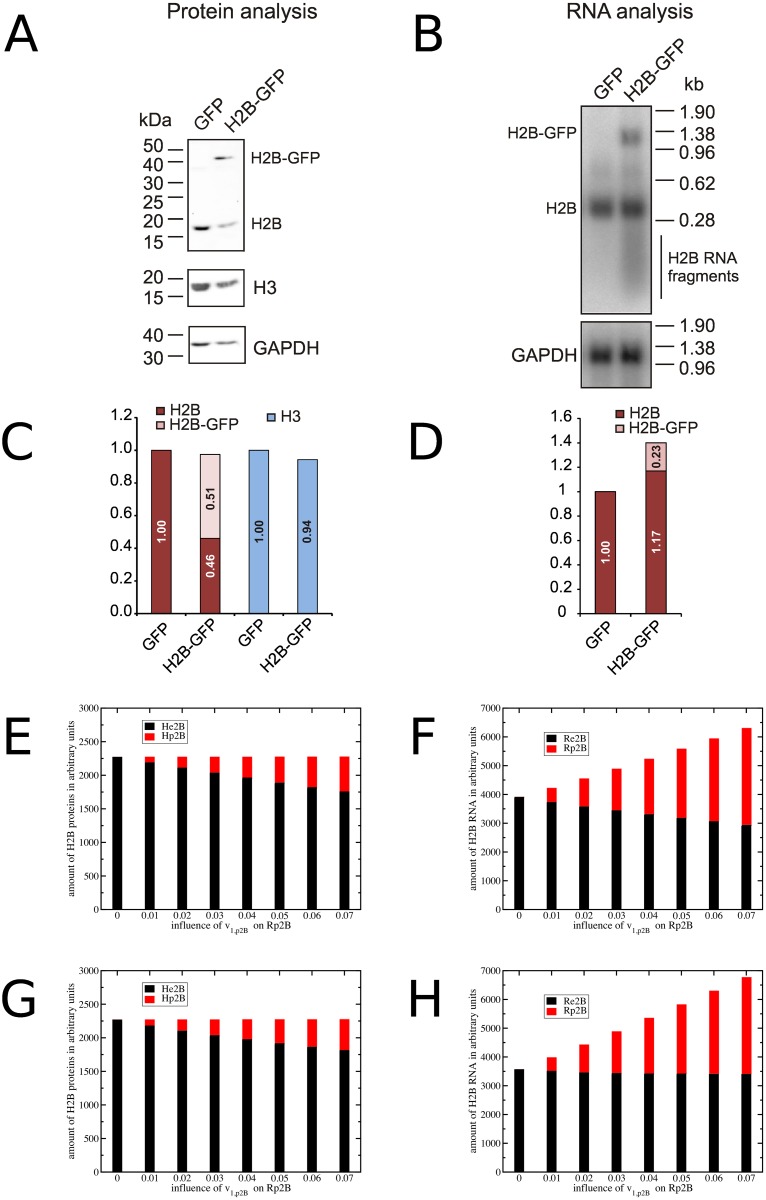
Fig 6. Evidence for a feedback control mechanism that regulates histone gene expression.
U2OS cells were transfected with plasmids pEGFP- H2B (H2B-GFP) or pEGFP (GFP) and subjected to antibiotic selection produce stable lines prior to FACS and protein analysis. (A, C) Analysis of H2B protein levels. Proteins were separated by SDS PAGE and analysed by Western blotting. Shown are H2B, H3 and GAPDH protein levels. Histone protein levels were standardised with respect to GAPDH protein, with H2B or H3 protein levels in cells transfected with pEGFP (GFP) defined as 1. Note that endogenous H2B levels (H2B) are significantly reduced in cells expressing H2B-GFP. (B, D) Analysis of H2B RNA levels. H2B RNA levels were analysed by Northern blotting. Shown are H2B and GAPDH RNA levels. The RNA levels were standardised with respect to GAPDH RNA with H2B RNA levels in cells transfected with pEGFP (GFP) defined as 1. Model predictions of the averaged H2B proteins (E, G) and RNAs (F, H) from the histone feedback loop (E, F) and DNA coupled (G, H) model. Endogenous H2B is in black, exogenous H2B in red. The different bars in each plot illustrate the effect of the strength of the promoter controlling exogenous H2B expression.

