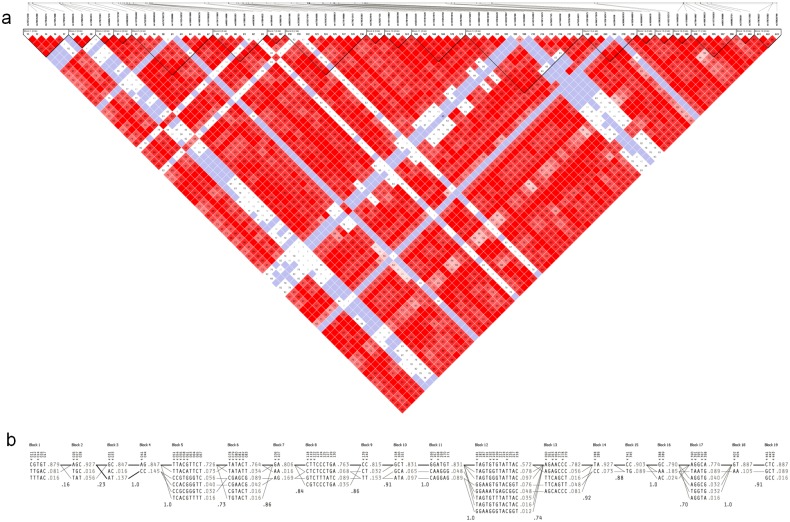
Fig 1. Analysis of haplotype structures at CYP2C19 locus in the Orang Asli.
(a) Linkage disequilibrium map showing 19 haplotype blocks along with the reference SNP cluster ID (rs). Bright red depicts very strong LD (LOD ≥2; D’ = 1), pink red (LOD ≥2; D’ < 1) and blue (LOD < 2; D’ = 1) for intermediate LD and white for no LD (LOD < 2, D’ < 1) between the pair of SNPs. Numbers in the square were the D’ value multiplied by 100. (b) Haplotype structures of CYP2C19 with tagged SNP indicated by an inverted triangle. Frequency of each haplotype is shown at the edge and the multi-allelic D’ value between each block is shown beneath. The most common crossings between haplotypes are indicated by thick lines whereas less common crossings are indicated by thinner lines.

