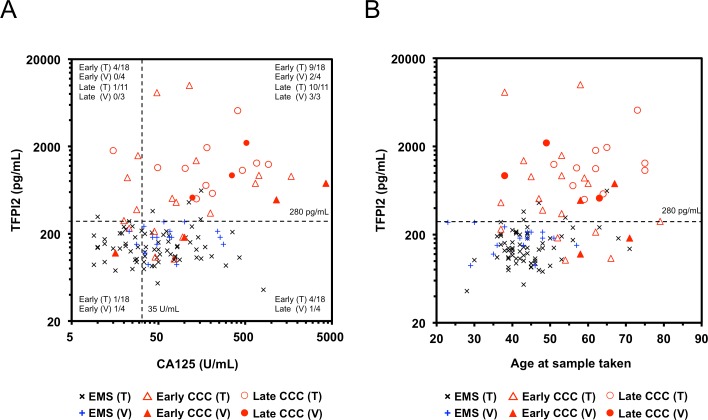
Fig 4. Correlation of serum TFPI2 levels vs. serum CA125 levels and age in CCC and in EMS patients.
Two-dimensional scatter graphs show serum levels vs TFPI2 and CA125 (A), and serum TFPI2 levels vs age (B), in patients with CCC or EMS in the training and validation sets. EMS, early-stage CCC, and late-stage CCC in the training and validation sets were individually plotted (black dots, EMS in training set; blue dots EMS in validation set; open triangles, early-stage CCC in training set; closed triangles, early-stage CCA in validation set; open circles, late-stage CCC in training set (T); closed circles, late-stage CCC in validation set (V). Dotted lines indicate a predetermined cutoff value (280 pg/mL) for TFPI2 for discrimination of CCC from EMS, and the generally used cutoff value (35 U/mL) for CA125.

