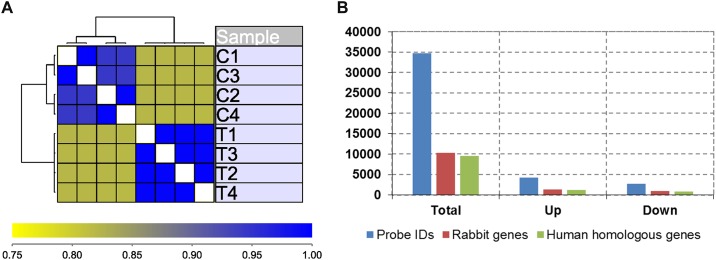
Fig 2. Gene expression profiling pulmonary arteries from control and PTE rabbits.
(A) Unsupervised clustering of gene expression datasets of pulmonary artery from four control and four PTE rabbits. (B) Total number of probes, rabbit gene numbers and matched homologous human genes on the expression array, as well as numbers of upregulated and downregulated genes in PTE rabbits compared to control rabbits.

