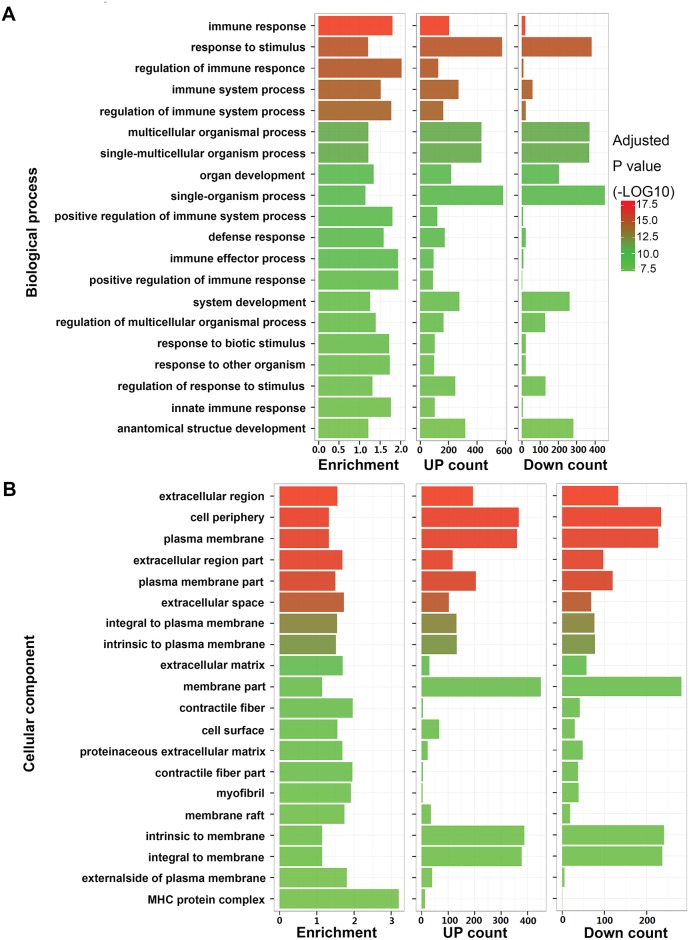
Fig 3. Functional analysis of differentially expressed genes in PTE pulmonary artery.
(A) Top twenty enriched biological processes. (B) Top twenty enriched cellular components. From left to right: enrichment fold, number of upregulated genes, and number of downregulated genes. Different P values are indicated by different colors.

