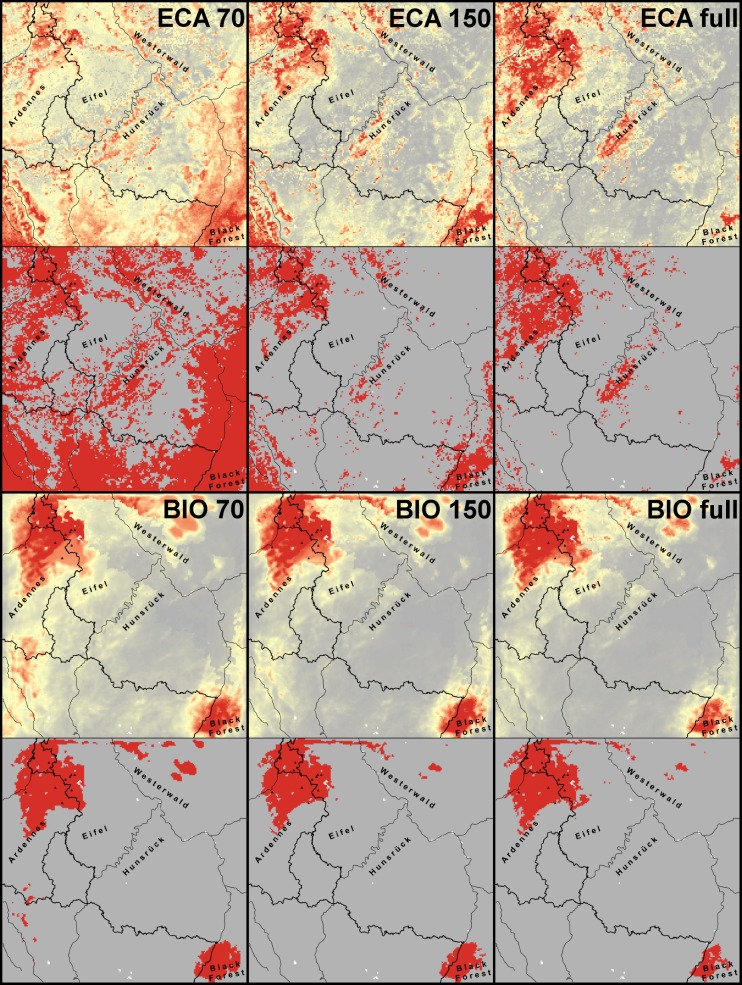
Fig 2. Predictions into the study region for the different Bsal SDMs.
Predicted suitability maps (top) with corresponding presence-absence maps (below) for the different models. High suitability and presences are indicated in red, low suitability and absences in grey. Bsal presences are indicated by black triangles.

