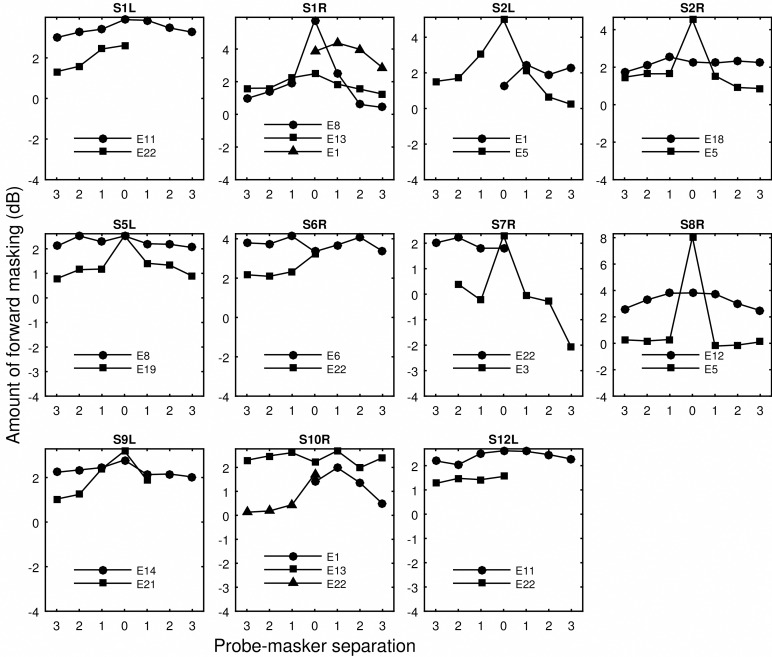
Fig 2. Raw forward masking as a function of probe-masker separation.
Data collected from different ears are shown in separate panels. Symbols indicate stimulation sites. Probe-masker separations (in number of electrodes) left to 0 indicate masker locations basal to the probe. Missing data indicate that the probe site is close to either the basal or apical end of the electrode array. The y axis shows the amount of forward masking (threshold elevation) in dB.

