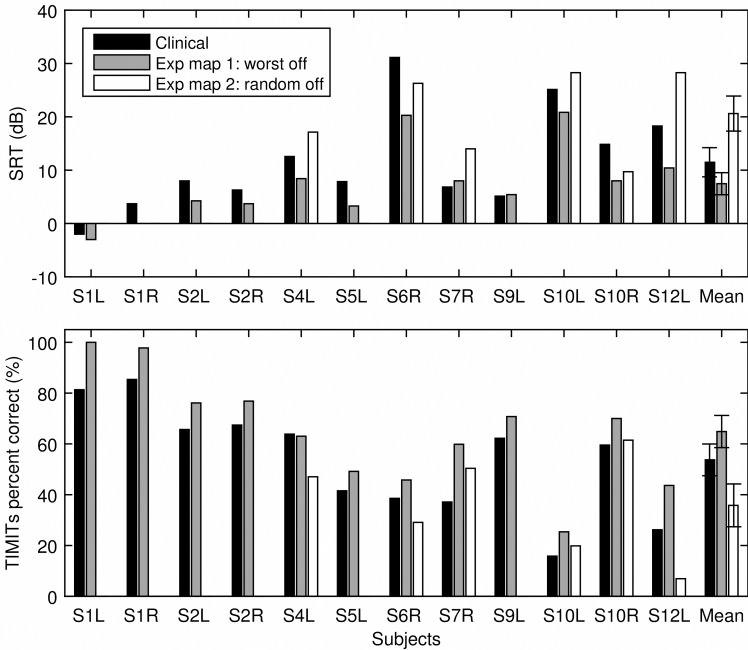
Fig 6. Speech recognition results.
SRTs (top panel) and percent correct scores for TIMIT sentences in quiet (bottom panel) are shown for individual subjects as well as the group mean using the clinical map (black bars), experimental map 1 (grey bars), and experimental map 2 (white bars). The error bars represent standard error.

