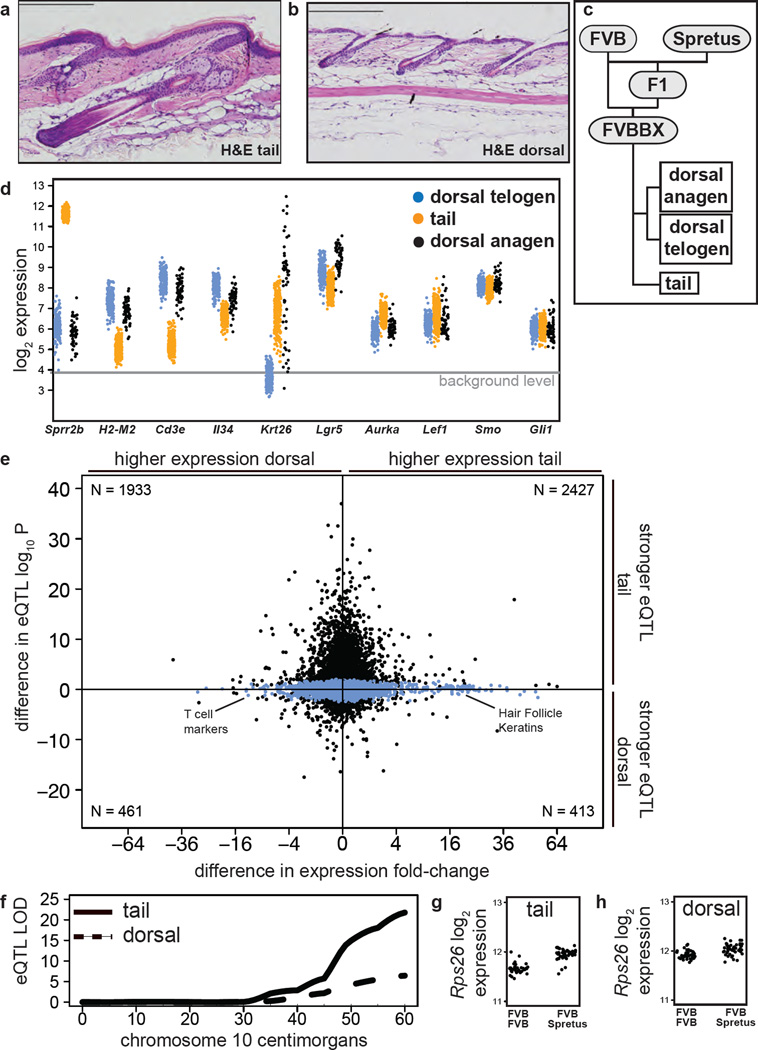
Figure 1. Synchronized expression of major signaling pathways in dorsal skin.
(a,b) Hematoxylin and eosin stain of (a) tail skin and (b) dorsal skin from an eight-week-old mouse. Scale bars indicate 500 µM. (c) Outline of FVBBS breeding scheme and tissues obtained. (d) Gene expression levels of key genes in tail, dorsal anagen, and dorsal telogen skin. (e) Scatter plot comparing the difference in eQTL effect size for each probeset in tail and dorsal samples (y-axis) with the difference in mean expression levels in tail and dorsal samples (x-axis). Probes with significant eQTL in either tail or dorsal skin drawn in black; otherwise drawn in blue. The genes with the largest increase in eQTL strength tended to have the smallest change in gene expression levels. (f) Statistical strength of the eQTL for Rps26 in tail skin (solid line) and dorsal skin (dashed line) on chromosome 10. Expression of Rps26 in (g) tail skin and (h) dorsal skin separated by genotype at Chromosome 10, 118 Mb. F/F: homozygous FVB/N; F/S: heterozygous FVB/N / Spret/Ei.

