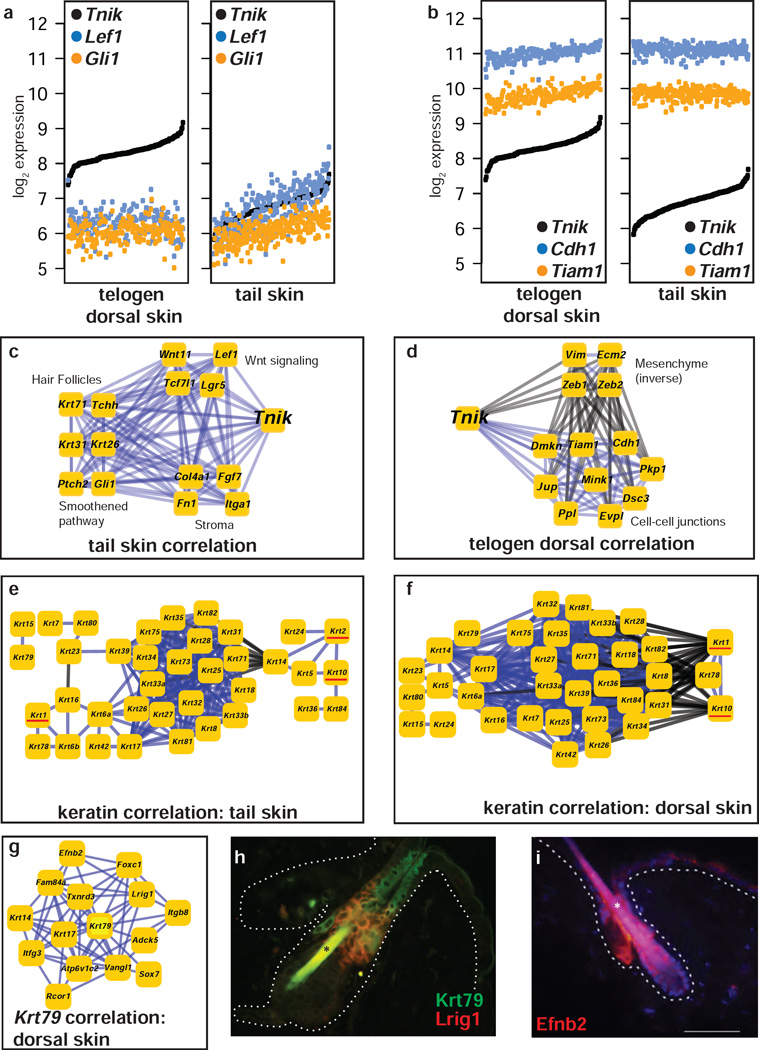
Figure 2. Keratin correlation networks in tail and dorsal skin.
(a, b) Gene expression levels of (a) Tnik, Lef1, and Gli1 and (b) Tnik, Cdh1, and Tiam1 in mouse dorsal telogen and tail skin, sorted by increasing Tnik expression. (c, d) Gene expression correlation of genes differentially expressed with Tnik expression in (c) tail skin and (d) telogen dorsal skin. (e,f) Gene expression correlation networks for all keratins in (e) tail skin and (f) dorsal skin; Krt1, Krt2, Krt10 underlined where present. Edges connect genes (boxes) with significantly genes expression; black edges are inverse correlation, blue edges direct correlation. (g) Gene expression correlation network for Krt79. (h, i) Immunofluorescence image for antibodies against (h) Lrig1 (red) and Krt79 (green) in FVB mice and (i) Efnb2.

